
Radiomics in precision medicine for lung cancer
Introduction
Lung cancer is one of the most aggressive human cancers worldwide, with a 5-year overall survival of 10–15%, showing no significant improvement over the last three decades (1,2). In total, 87% of lung cancers are diagnosed with non-small cell lung carcinoma (NSCLC), which includes adenocarcinoma, squamous cell carcinoma, and large cell carcinoma histological types. Lung cancers are classified according to molecular subtypes, predicated on particular genetic alterations that drive and maintain lung tumorigenesis (3). Such driver mutations, and the associated constitutively active mutant signaling proteins, are critical to tumor cell survival, leading to the development of novel targeted therapies (4). Currently, the standard of care for unresectable NSCLC tumors is concurrent chemoradiation that showed more than half treatment failing locally (5). Recent evidence suggests that pre- and post-treatment anatomical or functional/molecular imaging information could be used to tailor treatment type and intensity, and predict treatment outcomes in radiotherapy. For instance, changes in tumor volume on computed tomography (CT) have been used to predict radiotherapy response in NSCLC patients (6,7). Functional/molecular imaging, in particular positron emission tomography (PET) with 18F-fludeoxyglucose (FDG), has received special attention as a potential prognostic factor for predicting radiotherapy efficacy (8), and has been shown to be useful for the delineation of radiation targets of stage III NSCLC (9,10). For instance, the prognostic value of pre- and mid-radiotherapy FDG-PET/CT metrics was examined for 77 patients with stage III NSCLC treated with modestly intensified radiation dose (median radiation dose of 66 Gy) (11). Some pre- and mid-radiotherapy PET metrics were found prognostic of the local recurrence and regional/distant recurrence, but not on the overall survival.
Advances in delivery and imaging technologies put a step forward into a new era of image-guided and adaptive radiotherapy (IGART), which has witnessed burgeoning interest in applying different imaging modalities, both to define the target volume and to predict treatment response. In modern IGART, there is a strong interest for using multimodal imaging in tumor staging and optimizing the treatment planning of different cancer types (12). The goal is to achieve improved target definition by incorporating complementary anatomical information [CT, magnetic resonance (MR), ultrasound, etc.] coupled with an improved disease characterization and localization using functional and molecular imaging (PET, functional MR, etc.). Recently, a dose-escalation adaptive treatment target volume to the responding tumor defined on mid-treatment FDG-PET demonstrated great promise to deliver high-dose radiation (up to a total dose of 86 Gy) to the more aggressive areas of locally stage I-III NSCLC tumors with a reasonable rate of radiotherapy-induced toxicity (13). This clinical trial of 42 patients achieved its primary goal to improve 2-year local-regional tumor control rates, with an infield tumor control rate of 82% and overall tumor control rate of 62%, and a 5-year overall survival rate of 30% (13). Moreover, using mid-radiotherapy FDG-PET/CT on stage III NSCLC patients, it was found that without high-dose radiation escalation, the 2-year cumulative incidence of local recurrence was about 24% (11), while the RTOG 0617 rate was around 34% (14).
In radiation oncology, information from imaging data has been related to treatment endpoints, although extracting relevant features to a particular task remains challenging and not fully explored. The problem could be addressed according to an engineering ‘pattern recognition’ approach, as previously proposed (15), which requires understanding of the clinical endpoint and the characteristics of the imaging modality. This process of extraction of quantitative information from anatomical/molecular images with their corresponding biological information and clinical endpoints is a new emerging field referred to as ‘radiomics’ (16,17). Radiomics could be thought of as consisting of two main steps: (I) extraction of quantitative imaging static and dynamic features from a previously defined tumor region; and (II) the imaging features or traits are then incorporated into mathematical models for treatment outcome prediction that is aimed at providing added value for personalizing of treatment regimens in comparison with commonly used clinical predictors.
NSCLC has been on the forefront of radiomics studies, including CT-based radiomic signature consisting of three features shown to predict distant metastasis in lung adenocarcinoma (18). Histological subtype (adenocarcinoma or squamous cell carcinoma) were predicted with features extracted from pretreatment CT images using the Relief feature selection method and a Naïve Bayes’ classifier with an AUC of 0.72 for tumor histology (19). A combination of image radiomics and clinical factors improved prediction of disease-free survival (20). The combination of PET/CT was shown to predict local control (21). Changes in radiomics features (delta-radiomics) was shown to predict NSCLC outcomes (22). A general review of radiomics in radiotherapy is provided by Avanzo et al. (23). In the following, we provide a description of the mechanics involved for conducting radiomics analysis in lung cancer using single and/or multi-modality imaging data.
Methods
Image segmentation
Medical image segmentation is a process to separate structures of interest in an image from its background or other neighboring structures. It is a necessary prerequisite step for many medical imaging applications including radiomics. There are several commercial and academic software tools that support different segmentation algorithms. In general, commercial software packages have better implementations with a user-friendly interface for manual and semi-automatic segmentation methods, but often lag behind the latest developments in the field. In contrast, academic software packages, such as ITK (24), BioImage Suite (25), MIPAV (26), and ImageJ (27), 3D slicer (28) may tend to be oriented towards single-modality applications and less friendly in handling multimodality images as sometimes may be required. These algorithms go under different categories. For instance, Pham and coworkers divided segmentation algorithms into eight different categories: thresholding, region growing, classifiers, clustering, Markov random field models, artificial neural networks, deformable models and atlas-guided approaches (29). Among the most robust image segmentation are based on deformable models (snakes or level sets), which are geometric representations of curves or surfaces that are defined explicitly or implicitly in the imaging domain. These models move under the influence of internal forces (contour curvature) and external forces (image boundary constraints) (30,31). An example showing joint segmentation of PET/CT in lung cancer is shown in Figure 1 using a multi-valued level set algorithm (32).

Image features extraction
The features extracted from images could be divided into static (snapshot of enhancement at one point in time) and dynamic (time variant) features according to the acquisition protocol at the time of scanning, and into pre- or intra-treatment features according to the scanning time point (33). The static features are based on intensity, object morphology, and texture as presented in our previous work on pattern recognition analysis in PET images (15) or our similarity learning in content-based retrieval from mammogram databases (34,35). The dynamic features are extracted from time-varying acquisitions such as dynamic PET, SPECT or MR. These features are based on kinetic analysis using tissue compartment models and parameters related to transport and binding rates (36).
Static image features
Several static image features can be applied to radiomics studies.
Standard uptake value (SUV) descriptors of PET
The radiotracer intensity values are extracted PET images and are converted into SUVs with statistical descriptors such as maximum, minimum, mean, standard deviation (SD), and coefficient of variation (CV). SUV is a standard method in PET image quantitative analysis (37), and similarly for CT analogous metrics could be derived from the Hounsfield units (HU) or summarizing intensity statistics in case of MRI.
Intensity volume histogram (IVH)
The IVH is defined in analogous fashion to the dose volume histogram (DVH): each point on the IVH defines the absolute or relative volume of that structure that exceeds a variable intensity threshold as a percentage of the maximum intensity. The IVH is thus intended to play the same role of as the DVH in reducing complicated 3D data into a single easier histogram to interpret. This method would allow for extracting several metrics from functional images for outcome analysis such as Ix (minimum intensity to x% highest intensity volume), Vx (percentage volume having at least x% intensity value), and descriptive statistics (mean, minimum, maximum, standard deviation, etc.).
Texture features
There are several types of texture features that have already been used in different studies, such as texture features using gray-level co-occurrence matrices (GLCM), neighborhood gray-tone difference matrices (NGTDM), gray-level run length matrices (GLRLM), and gray-level size zone matrices (GLSZM), or Laws energy measures (38,39). Here, we briefly describe the GLCM features, which is among the most commonly used textures as an example. The matrix representing the number of times that defined intensity levels (indexed by i and j) occur between neighboring voxels in the entire 3D image. Mathematically, this can be viewed as an extension of the second-order joint conditional probability density function of a given texture image. For an image with M intensity bins, the co-occurrence matrix size is M×M. The M levels are obtained by applying an image quantization method to limit the size of the matrix. Typical values for M are selected in powers of 2 (8, 16, 32, 64, etc.). It should be emphasized that these metrics are independent of tumor position, orientation, size, and brightness, and take into account the local intensity-spatial distribution (40,41). This is a crucial advantage over direct (first-order) histogram metrics (e.g., mean and standard deviation), which only measures intensity variability independent of the spatial distribution in the tumor microenvironment.
Dynamic image features
In order to quantify a contrast agent or a tracer dynamic behavior in a neighborhood (which can be one or more voxels) basis, compartment modeling approaches are typically used in dynamic imaging acquisitions (36). As an example, we briefly review the characteristics of compartment models used for FDG-PET and similar principles are applied in cases of dynamic CT or MRI.
Kinetic model for FDG (36). A 3-compartment model is used to depict the trapping of FDG-6-Phosphate (FDG6P) in tumor. In Figure 2, Cb(t) denotes the input function; C1(t) the concentration of un-phosphorylated FDG; and C2(t) the concentration of FDG-6-Phosphate. The bi-directional transport across the membrane via GLUTs is represented by the rate-constants K1 and k2, the phosphorylation of FDG is denoted by k3 while the action of G6-phophatase is represented with rate constant k4. We will start the analysis assuming k4=0, but we will explore non-zero k4. Using estimates of compartmental modeling, measures of FDG uptake rate (K) will be evaluated by the relation KFDG = K1*k3 /(k2+k3) We expect that statistical properties of the neighborhood K values to be predictive of local control.

Multi-metric modeling of response
In the context of data-driven outcomes modeling, the observed treatment outcome is considered to be caused by multiple dosimetric, clinical, and biological input variables (42). Outcomes in radiation oncology are generally characterized by two metrics: tumor control probability (TCP) and the surrounding normal tissue complication probability (NTCP) (43,44). Before outcomes modeling, features selection will be used to find the best subset of features for the models. There are principally three types of techniques existing for the feature selection task: filter method, wrapper method and embedded method (45). Filter-based method is an information-based method that is computationally efficient, including mutual information, correlation-based and relief method. The wrapper method uses the prediction performance of a classifier to assess the importance of the features, while the embedded method implements the selection of features in the process of the training. With the optimized chosen feature, a data-driven model can be build such as classical logistic regression approaches or more advanced machine learning techniques.
For more details about outcome modeling in radiotherapy, the reader can refer to our previous work (46) and to the dose-response explorer system (DREES) that is a dedicated software tool for this purpose (47). Below, we will show examples using standard logistic regression and more advanced machine learning.
Outcome modeling by logistic regression
Logistic modeling is a common tool for multi-metric modeling. In our previous work (42,48), a logit transformation was used:

where n is the number of cases (patients), xi is a vector of the input variable values (i.e., image features) used to predict f (xi) for outcome yi (i.e., TCP or NTCP) of the ith.
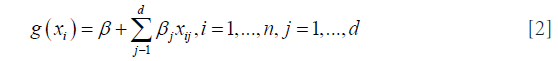
where d is the number of model variables and the ß's are the set of model coefficients determined by maximizing the probability that the data gave rise to the observations. The number of parameters can be determined from the feature selection approach or by incorporating all features and applying shrinkage methods such as LASSO (49).
Outcome modeling by machine learning
Machine learning represents a wide class of artificial intelligence techniques [e.g., neural networks, decision trees, support vector machines (SVM)], which are able to emulate living beings’ intelligence by learning the surrounding environment from the given input data. Basically SVM [see for e.g. (50)] and neural networks are both based on supervised learning that is typically used in image-based outcome modeling, aiming at estimating an unknown (input, output) mapping from known (input, output) samples. These methods are increasingly being utilized in radiation oncology because of their ability to detect nonlinear patterns in the data (51). In particular, neural networks were extensively investigated to model post-radiation treatment outcomes for cases of lung injury (52,53). Learning is defined in this context as estimating dependencies from data (54).
From data with input and labels yi, D = {(xi, yi) ∈ Rn × C | i =1,2,3,..N} of N total samples, a function f:Rn → C can be found, such that f(xi) ≅ yi for each sample i. Two types of algorithm can be encountered: classification, when the target set C is discretized or regression when C =R. For instance, taking a binary classification (e.g. low/high risk of tumor failure) represented by C ={1,-1}, SVM would seek for a developing hyperplane in some higher dimension such that the data points are separated with the maximal margin according to their labels (Figure 3A). Mathematically, SVM is then described by an optimization problem:
Maxw,b,rr

with,

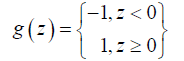
where r ∈ R,w ∈ Rn and yi = {1, -1} are variables to be optimized. Essentially, the objective function r is the maximal margin to be found, and the constraints impose the lower bound of each datapoint (xi, yi) to the decision boundary to be greater than r at least. Thus, the optimal weights (w, b) uniquely determine a SVM binary classifier:

where, the indicator function is defined by
On the other hand, neural network constructs a nonlinear function using self-iterations in sets of matrix (weights) 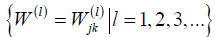 and
and 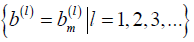 vectors (bias) such that,

where, is a designated nonlinear function called activation, which plays an important part in neural network. From (d), the sets of weights and bias uniquely determine a neural network function fNN, and the nonlinearity is understood to stem solely from the activation functions . Also, here “W(1),W(2),…” denote the matrix form of weights and similar for the bias vectors “b(1),b(2),…”. The index l= 1,2,3,… indicating the depth in weights and bias are called layers (Figure 3B). A shallow network (small number of layers) can represent a very complex function as long as the number of neurons is sufficiently large, and the deeper in layer, the more complex functions neural network can represent. Under the supervision, i.e., imposing fNN(xi) ≅ yi, it then gives the best weights and bias  to be utilized.
Among all the machine learning techniques, the deep neural network has recently showed impressive performance in a variety of biomedical problems, such as patient classification, treatment planning, and biological process understanding. These methods do not require explicit extraction of features as discussed above. For instance, Kuruvilla et al. presented lung cancer classification using static features extracted from segmented lung with feedforward and feedforward backward propagation network (55). They used thirteen training functions (back propagation neural networks) for classification, as previously proposed by Paulin et al. (56). This method allowed to find tumor classification with an accuracy of 93.3%, a specificity of 100% and a sensitivity of 91.4% (55). In addition, Kumar et al. proposed to use deep features extracted in CT images from an autoencoder, which is based on neural networks to “encode” the data to a latent space, along with a binary decision tree (e.g., malignant vs. benign) as a classifier for lung cancer classification (57). On the output layer, a “decoding” transformation is used for data reconstruction to obtain learned features that are extracted and implemented to the trained classifier.
Examples of radiomics application in lung cancer
Modeling of patients’ survival from CT imaging
Aerts et al. (58) built a radiomic signature consisting of a combination of four features, ‘Statistics Energy’ describing the overall density of the tumor, ‘Shape Compactness’ quantifying how compact the tumor shape is, ‘Gray Level Nonuniformity’ a measure for heterogeneity and wavelet ‘Gray Level Nonuniformity HLH’, also describing intra-tumor heterogeneity after decomposing the image in mid-frequencies. The signature was obtained by selecting the most stable features using the RIDER dataset, and then trained on a set of 422 lung cancer patients for the prediction of survival. The signature, assessed on an independent lung dataset, was predictive for survival with a c-index (CI) of 0.65, and was successfully tested on cohorts of different cancer types (lung, head and neck cancer) thus demonstrating the translational capability of radiomics across different cancers. In the same study, gene expression of 89 patients from a lung cancer cohort was measured for 21,766 genes, and revealed significant associations between the radiomic features and gene-expression patterns.
Modeling of patient survival using PET imaging
Ohri el al. (59) have recently published a radiomics model from a multi-center data of 201 patients. Using the LASSO procedure, they identified 1 textural feature calculated from GLCM, SumMean, as an independent predictor of overall survival that complement volume [metabolic tumor volume (MTV)] in decision tree. The optimal cutpoint for the MTV was found to 93.3 cm3, and the optimal SumMean cutpoint for tumors above 93.3 cm3 in the decision tree was 0.018 (Figure 4).

Modeling of tumor response using PET/CT
There is an inherent advantage of combining imaging information from multiple modalities such as PET/CT or PET/MRI. In a retrospective study of 30 NSCLC patients (33), thirty features were extracted from both PET and CT images with and without motion-correction as shown in Figure 5. The features included tumor volume; SUV/HU measurements, such as mean, minimum, maximum, and the standard deviation; IVH metrics; and texture based features such as energy, contrast, local homogeneity, and entropy. The data corrected for motion artifacts based on a population-averaged probability spread function (PSF) using de-convolution methods derived from four 4D-CT data sets (60). An example of such features in this case is shown in Figure 5. Then, these features can be implemented in the DREES software (Figure 6) to predict local failure (21), which consisted of a model of 2-parameters from features from both PET and CT based on IVHs provided the best performance.


Radiogenomics example
In addition to relating imaging information to clinical endpoints, it could be also related to biological and genotypic molecular signatures. The identification of patients with presence of mutations of epidermal growth factor receptor (EGFR) in NSCLC is of great interest as they may respond to EGFR-targeted drugs and molecular methods used to detect EGFR mutations are expensive. Radiomic feature Laws-Energy on the pretreatment CT scan was significantly predictive for EGFR-mutation status. A radiomic model for identification of EGFR mutant status from tumor segmented semi-automatically on CT using seed-based region growing method was developed through multiple logistic regression and pairwise selection with moderate predictive power (AUC, 0.647; 95% confidence interval: 0.576–0.701). The model improved the AUC to 0.709 by including also clinical variables (61). An example is shown in Figure 7. Gene fusion have been become of clinical interest as fusion-positive patients may benefit by targeted drugs.

Discussion
The use of imaging in outcome modeling of radiotherapy response has witnessed rapid increase in recent years adding more value to already existing use of imaging in cancer treatment in general and radiotherapy in particular. However, there are several issues that are currently limiting its rapid progression. It is well recognized that image acquisition protocols may impact the reproducibility of extracted features from image modalities, which may consequently impact the robustness and stability of these features for treatment prediction. This includes static features such as SUV/HU/MRI descriptors and texture features. Interestingly, texture-based features were shown to have a reproducibility similar to or better than that of simple SUV descriptors (62). This demands protocols for standardized acquisition. In addition, factors that may impact the stability of these features also include signal-to-noise ratio (SNR), partial volume effect, motion artifacts, parameter settings, resampling size, and image quantization (15,63). Indeed, a 3D (static) PET may fail to provide accurate position, volume, and absorbed activity distribution for a mobile tumor. Conventional (3D) PET/CT was compared to respiratory-gated (4D) PET/CT PET to assess the impact of respiratory motion in the variability of features extracted in phantoms (64) and in lung cancer patient (65). An inconsistency of long axis length between 3D images and 4D images at inhale/exhale, indicated that tumor shape and rotation varied between phases (65). Nevertheless, advances in hardware and software technologies will further facilitate wider application of advanced image processing techniques to medical imaging to achieve better clinical results. For instance, pre-processing methods such as denoising and deconvolution methods already help in mitigating such artifacts (66,67), however, more advanced image restoration methods based on nonlocality and sparsity may be more fruitful (68). Outcome modeling using logistic regression has become a de facto standard, however, more advanced modeling techniques such machine learning may provide further predictive power particularly when dealing with more complex and nonlinear relationships among features and between clinical outcomes. We believe that the synergy between image analysis and machine learning (51) could provide powerful tools to strengthen and further the utilization of image-based outcome modeling in clinical practice towards improved clinical decision making and personalized medicine in the future.
Conclusions
In this review, we have presented an overview of possible applications of radiomics in lung cancer, ranging from basic image segmentation, outcome modeling, to deciphering genetic signatures. As the role of imaging continue to increase in lung cancer management, radiomics will follow suit. However, it is recognized that this field is still in its infancy with challenges such as image protocol standardization to breathing motion artifacts that may limit its reproducibility and possible use in clinical trials currently. Nevertheless, concerted effort by the research and the clinical community is aiming to mitigate these challenges and benefit from the potentials of radiomics in personalized precision medicine.
Acknowledgements
None.
Footnote
Conflicts of Interest: The authors have no conflicts of interest to declare.
References
- Stewart BW, Wild CP. World Cancer Report 2014 [Internet]. Cited 2017 Sep 1. Available online: http://publications.iarc.fr/Non-Series-Publications/World-Cancer-Reports/World-Cancer-Report-2014
- Jemal A, Siegel R, Ward E, et al. Cancer statistics, 2008. CA Cancer J Clin 2008;58:71-96. [Crossref] [PubMed]
- Pao W, Girard N. New driver mutations in non-small-cell lung cancer. Lancet Oncol 2011;12:175-80. [Crossref] [PubMed]
- Travis WD, Brambilla E, Riely GJ. New pathologic classification of lung cancer: relevance for clinical practice and clinical trials. J Clin Oncol 2013;31:992-1001. [Crossref] [PubMed]
- Blackstock AW, Govindan R. Definitive Chemoradiation for the Treatment of Locally Advanced Non-Small-Cell Lung Cancer. J Clin Oncol 2007;25:4146-52. [Crossref] [PubMed]
- Seibert RM, Ramsey CR, Hines JW, et al. A model for predicting lung cancer response to therapy. Int J Radiat Oncol Biol Phys 2007;67:601-9. [Crossref] [PubMed]
- Ramsey CR, Langen KM, Kupelian PA, et al. A technique for adaptive image-guided helical tomotherapy for lung cancer. Int J Radiat Oncol Biol Phys 2006;64:1237-44. [Crossref] [PubMed]
- de Geus-Oei LF, Oyen WJ. Predictive and prognostic value of FDG-PET. Cancer Imaging 2008;8:70-80. [Crossref] [PubMed]
- Konert T, Vogel W, MacManus MP, et al. PET/CT imaging for target volume delineation in curative intent radiotherapy of non-small cell lung cancer: IAEA consensus report 2014. Radiother Oncol 2015;116:27-34. [Crossref] [PubMed]
- Hallqvist A, Alverbratt C, Strandell A, et al. Positron emission tomography and computed tomographic imaging (PET/CT) for dose planning purposes of thoracic radiation with curative intent in lung cancer patients: A systematic review and meta-analysis. Radiother Oncol 2017;123:71-7. [Crossref] [PubMed]
- Gensheimer MF, Hong JC, Chang-Halpenny C, et al. Mid-radiotherapy PET/CT for prognostication and detection of early progression in patients with stage III non-small cell lung cancer. Radiother Oncol 2017. [Epub ahead of print]. [Crossref] [PubMed]
- Jaffray DA. Image-guided radiotherapy: from current concept to future perspectives. Nat Rev Clin Oncol 2012;9:688-99. [Crossref] [PubMed]
- Kong F-M, Ten Haken RK, Schipper M, et al. Effect of Midtreatment PET/CT-Adapted Radiation Therapy With Concurrent Chemotherapy in Patients With Locally Advanced Non-Small-Cell Lung Cancer: A Phase 2 Clinical Trial. JAMA Oncol 2017. [Epub ahead of print]. [Crossref] [PubMed]
- Bradley JD, Paulus R, Komaki R, et al. Standard-dose versus high-dose conformal radiotherapy with concurrent and consolidation carboplatin plus paclitaxel with or without cetuximab for patients with stage IIIA or IIIB non-small-cell lung cancer (RTOG 0617): a randomised, two-by-two factorial phase 3 study. Lancet Oncol 2015;16:187-99. [Crossref] [PubMed]
- El Naqa I, Grigsby P, Apte A, et al. Exploring feature-based approaches in PET images for predicting cancer treatment outcomes. Pattern Recognit 2009;42:1162-71. [Crossref] [PubMed]
- Lambin P, Rios-Velazquez E, Leijenaar R, et al. Radiomics: Extracting more information from medical images using advanced feature analysis. Eur J Cancer 2012;48:441-6. [Crossref] [PubMed]
- Kumar V, Gu Y, Basu S, et al. Radiomics: the process and the challenges. Magnetic Resonance Imaging 2012;30:1234-48. [Crossref] [PubMed]
- Coroller TP, Grossmann P, Hou Y, et al. CT-based radiomic signature predicts distant metastasis in lung adenocarcinoma. Radiother Oncol 2015;114:345-50. [Crossref] [PubMed]
- Wu W, Parmar C, Grossmann P, et al. Exploratory Study to Identify Radiomics Classifiers for Lung Cancer Histology. Front Oncol 2016;6:71. [Crossref] [PubMed]
- Huang Y, Liu Z, He L, et al. Radiomics Signature: A Potential Biomarker for the Prediction of Disease-Free Survival in Early-Stage (I or II) Non-Small Cell Lung Cancer. Radiology 2016;281:947-57. [Crossref] [PubMed]
- Vaidya M, Creach KM, Frye J, et al. Combined PET/CT image characteristics for radiotherapy tumor response in lung cancer. Radiother Oncol 2012;102:239-45. [Crossref] [PubMed]
- Fave X, Zhang L, Yang J, et al. Using Pretreatment Radiomics and Delta-Radiomics Features to Predict Non-Small Cell Lung Cancer Patient Outcomes. Int J Radiat Oncol Biol Phys 2017;98:249. [Crossref] [PubMed]
- Avanzo M, Stancanello J, El Naqa I. Beyond imaging: The promise of radiomics. Phys Med 2017;38:122-39. [Crossref] [PubMed]
- Yoo TS, Ackerman MJ, Lorensen WE, et al. Engineering and algorithm design for an image processing Api: a technical report on ITK--the Insight Toolkit. Stud Health Technol Inform 2002;85:586-92. [PubMed]
- Papademetris X, Jackowski MP, Rajeevan N, et al. BioImage Suite: An integrated medical image analysis suite: An update. Insight J 2006;2006:209. [PubMed]
- McAuliffe MJ, Lalonde FM, McGarry D, et al. Medical Image Processing, Analysis and Visualization in clinical research. 14th IEEE Symposium on Computer-Based Medical Systems. Bethesda, MD, 2001:381-6. Available online: http://ieeexplore.ieee.org/document/941749/
- Abramoff MD, Magalhães PJ, Ram SJ. Image processing with ImageJ. Biophotonics International 2004;11:36-42.
- Fedorov A, Beichel R, Kalpathy-Cramer J, et al. 3D Slicer as an Image Computing Platform for the Quantitative Imaging Network. Magn Reson Imaging 2012;30:1323-41. [Crossref] [PubMed]
- Pham DL, Xu C, Prince JL. Current Methods in Medical Image Segmentation. Annu Rev Biomed Eng 2000;2:315-37. [Crossref] [PubMed]
- Sethian JA. Level Set Methods and Fast Marching Methods: Evolving Interfaces in Computational Geometry, Fluid Mechanics, Computer Vision, and Materials Science. Cambridge: Cambridge University Press, 1999:402.
- Xu C, Pham D, Prince J. Image Segmentation Using Deformable Models. In: Sonka M, Fitzpatrick J. editors. Handbook of Medical Imaging. Medical Image Processing and Analysis. SPIE Press, 2000:129-74.
- El Naqa I, Yang D, Apte A, et al. Concurrent multimodality image segmentation by active contours for radiotherapy treatment planning. Med Phys 2007;34:4738-49. [Crossref] [PubMed]
- Naqa IE. The role of quantitative PET in predicting cancer treatment outcomes. Clin Transl Imaging 2014;2:305-20. [Crossref]
- El Naqa I, Wei L, Yang Y. Content-based image retrieval for digital mammography. In: Mohammed S, Fiaidhi J. editors. The Ubiquity 2.0 Trend and Beyond. Hershey: IGI Global, 2010:485-508.
- El-Naqa I, Yang Y, Galatsanos NP, et al. A similarity learning approach to content-based image retrieval: application to digital mammography. IEEE Trans Med Imaging 2004;23:1233-44. [Crossref] [PubMed]
- Watabe H, Ikoma Y, Kimura Y, et al. PET kinetic analysis--compartmental model. Ann Nucl Med 2006;20:583-8. [Crossref] [PubMed]
- Strauss LG, Conti PS. The applications of PET in clinical oncology. J Nucl Med 1991;32:623-648; discussion 649-650. [PubMed]
- Khalil MM. editor. Basic Science of PET Imaging. Springer, 2017. Available online: http://link.springer.com/content/pdf/10.1007/978-3-319-40070-9.pdf
- Vallières M, Freeman CR, Skamene SR, et al. A radiomics model from joint FDG-PET and MRI texture features for the prediction of lung metastases in soft-tissue sarcomas of the extremities. Phys Med Biol 2015;60:5471. [Crossref] [PubMed]
- Castleman KR. editor. Digital Image Processing. New Jersey: Prentice Hall Inc., 1979.
- Haralick RM, Shanmugam K, Dinstein I. Textural Features for Image Classification. IEEE Transactions on Systems, Man, and Cybernetics 1973;SMC-3:610-21. [Crossref]
- Deasy J, El Naqa I. Image-Based Modeling of Normal Tissue Complication Probability for Radiation Therapy. In: Bentzen SM, Harari PM, Mackie TR, et al. editors. Radiation Oncology Advances. Springer, 2007.
- Steel GG. editor. Basic clinical radiobiology. 3rd ed. London: Arnold; New York: Oxford University Press, 2002. Available online: http://trove.nla.gov.au/version/45382700
- Webb SP. editor. The physics of three-dimensional radiation therapy conformal radiotherapy, radiosurgery, and treatment planning. Bristol: UK Institute of Physics Pub, 2001. Available online: http://trove.nla.gov.au/work/10354339
- Guyon I, Elisseeff A. An introduction to variable and feature selection. J Mach Learn Res 2003;3:1157-82.
- El Naqa I. Outcomes Modeling. In: Starkschall G, Alfredo R, Siochi C. editors. Informatics in Radiation Oncology. CRC Press, 2013:257-75.
- El Naqa I, Suneja G, Lindsay PE, et al. Dose response explorer: an integrated open-source tool for exploring and modelling radiotherapy dose-volume outcome relationships. Phys Med Biol 2006;51:5719-35. [Crossref] [PubMed]
- El Naqa I, Bradley J, Blanco AI, et al. Multivariable modeling of radiotherapy outcomes, including dose-volume and clinical factors. Int J Radiat Oncol Biol Phys 2006;64:1275-86. [Crossref] [PubMed]
- Tibshirani RJ. Regression shrinkage and selection via the lasso. J R Stat Soc B 1996;58:267-88.
- Vapnik VN, Vapnik V. Statistical learning theory. Vol. 1. New York: Wiley, 1998. Available online: http://www.dsi.unive.it/~pelillo/Didattica/Artificial%20Intelligence/Old%20Stuff/Slides/SLT.pdf
- El Naqa I, Li R, Murphy MJ. editors. Machine learning in radiation oncology: theory and applications. Springer, 2015.
- Munley MT, Lo JY, Sibley GS, et al. A neural network to predict symptomatic lung injury. Phys Med Biol 1999;44:2241-9. [Crossref] [PubMed]
- Su M, Miften M, Whiddon C, et al. An artificial neural network for predicting the incidence of radiation pneumonitis. Med Phys 2005;32:318-25. [Crossref] [PubMed]
- Hastie T, Tibshirani R, Friedman JH. The elements of statistical learning: data mining, inference, and prediction: with 200 full-color illustrations. New York: Springer Google Scholar, 2001.
- Kuruvilla J, Gunavathi K. Lung cancer classification using neural networks for CT images. Comput Methods Programs Biomed 2014;113:202-9. [Crossref] [PubMed]
- Paulin F, Santhakumaran A. Back propagation neural network by comparing hidden neurons: case study on breast cancer diagnosis. Int J Comput Appl 2010;2:40-4.
- Kumar D, Wong A, Clausi DA. Lung Nodule Classification Using Deep Features in CT Images. 2015 12th Conference on Computer and Robot. Vision 2015:133-8.
- Aerts HJ, Velazquez ER, Leijenaar RT, et al. Decoding tumour phenotype by noninvasive imaging using a quantitative radiomics approach. Nat Commun 2014;5:4006. [PubMed]
- Ohri N, Duan F, Snyder BS, et al. Pretreatment 18F-FDG PET Textural Features in Locally Advanced Non-Small Cell Lung Cancer: Secondary Analysis of ACRIN 6668/RTOG 0235. J Nucl Med 2016;57:842-8. [Crossref] [PubMed]
- Naqa IE, Low DA, Bradley JD, et al. Deblurring of breathing motion artifacts in thoracic PET images by deconvolution methods. Med Phys 2006;33:3587-600. [Crossref] [PubMed]
- Aerts HJ, Grossmann P, Tan Y, et al. Defining a Radiomic Response Phenotype: A Pilot Study using targeted therapy in NSCLC. Sci Rep 2016;6:srep33860.
- Tixier F, Hatt M, Le Rest CC, et al. Reproducibility of tumor uptake heterogeneity characterization through textural feature analysis in 18F-FDG PET. J Nucl Med 2012;53:693-700. [Crossref] [PubMed]
- Cheng NM, Fang YH, Yen TC. The promise and limits of PET texture analysis. Ann Nucl Med 2013;27:867-9. [Crossref] [PubMed]
- Carles M, Torres-Espallardo I, Alberich-Bayarri A, et al. Evaluation of PET texture features with heterogeneous phantoms: complementarity and effect of motion and segmentation method. Phys Med Biol 2017;62:652. [Crossref] [PubMed]
- Oliver JA, Budzevich M, Zhang GG, et al. Variability of Image Features Computed from Conventional and Respiratory-Gated PET/CT Images of Lung Cancer. Transl Oncol 2015;8:524-34. [Crossref] [PubMed]
- El Naqa I, Kawrakow I, Fippel M, et al. A comparison of Monte Carlo dose calculation denoising techniques. Phys Med Biol 2005;50:909-22. [Crossref] [PubMed]
- Zaidi H, Abdoli M, Fuentes CL, et al. Comparative methods for PET image segmentation in pharyngolaryngeal squamous cell carcinoma. Eur J Nucl Med Mol Imaging 2012;39:881-91. [Crossref] [PubMed]
- Gunturk BK, Li X. Image restoration: fundamentals and advances. CRC Press, 2012. Available online: https://books.google.fr/books?hl=fr&lr=&id=MHPhrxEaOfcC&oi=fnd&pg=PP1&dq=Gunturk+BK,+Li+X,+eds.+Image+Restoration:+Fundamentals+and+Advances.+Boca+Raton,+FL:+CRC+Press,+Taylor+and+Francis+group%3B+2012&ots=o304Rmxg1i&sig=exo9soQB3VauQvCPteFpDrFmIXQ

