

Whole genome sequencing revealed microbiome in lung adenocarcinomas presented as ground-glass nodules
Introduction
The widespread use of advanced chest computed tomography (CT) to screen for lung cancer has dramatically increased detection of ground-glass nodules (GGNs) (1). Driver gene mutations are believed to initialize the tumorigenesis (2). However, how the GGNs occur and develop in the pre-stages of lung cancer is still elusive. In our recent study (3), we profiled the gene mutations of GGNs and found that many GGNs did not harbor the driver mutations that commonly occurred in lung adenocarcinomas (AD). We speculated that both the genetic background and/or the local microenvironment could play an important role in the initiation of GGNs.
The human microbiome confers benefits or disease susceptibility to the human body. Disruption of the symbiotic balance of the human microbiome was commonly found in systematic diseases such as chronic gastric diseases, diabetes, and obesity (4-6). Previous studies have suggested that dysbiosis of the microbiota may also play vital roles in carcinogenesis at multiple levels by affecting metabolic, inflammatory, or immune pathways. These included colorectal, gastric, hepatocellular, and pancreatic cancers (7,8). Although the impact of the gut microbiome on digestive system-related cancers has been widely explored, few studies have investigated the interplay between the microbiome and lung cancer. Since the first culture-independent report of the healthy lung microbiome, many published studies using molecular techniques for bacterial identification have found evidence of bacteria in the lower airways. Some recent studies have shown that certain microbes and microbiota dysbiosis are correlated with the development of lung cancer (9).
A better knowledge of the interplay between the lung microbiome and lung cancer will promote the development of innovative strategies for early prevention and personalized treatment in lung cancer, for example, detecting the core microbiota of GGNs and integrating with tumor genomics information. We applied shotgun whole genomic sequencing to all genomic content in a GGN lesion for both tumor genomic variation analysis and microbiota species identification. With high sequence coverage, shotgun metagenomics sequencing can detect rare and low-abundance members of the microbial community in tumor tissue samples.
Methods
Patients and tissue samples
Frozen tissues for whole-genome sequencing were obtained from patients who underwent surgical resection at the Shanghai Pulmonary Hospital between 2014 and 2015. Pathological diagnosis and staging were performed according to the International Multidisciplinary Classification of Lung Adenocarcinoma and the TNM staging system of the IASLC, version 8 (10). Two pathologists reviewed all samples to confirm the histology and assess the tumor content. We selected only synchronous multiple GGNs (SM-GGNs) patients with two GGN lesions, which were defined when all tumors exhibited GGN dominance with a consolidation/tumor ratio <0.5 based on thin-section CT findings, with one diagnosed as adenomatous hyperplasia (AAH) and another diagnosed as either adenocarcinoma in situ (AIS), minimally invasive carcinoma (MIA), or invasive AD. The institutional Ethics Committee of the Shanghai Pulmonary Hospital approved the study. Tumor and normal lung tissue were immediately placed in ice container after resection in a sterile environment. After enough slides were taken from the specimen for and postoperative pathological examination, the remaining specimen was put in −70 °C or liquid nitrogen tank for long term storage.
Whole-genome sequencing
DNA extraction from frozen specimen was conducted within 1 hour in the hospital laboratory using a QIAamp DNA Mini Kit (QIAGEN, Shanghai, China). The DNA samples were quantified with the NanoDrop system (Thermo Scientific, Shanghai, China) and then shipped in dry ice container to Novogene, Inc. (Beijing, China) for library preparation and sequencing. A paired-end DNA library was generated using a TruSeq Nano DNA HT Sample Preparation Kit (Illumina USA) following the manufacturer’s recommendations, and index codes were added to attribute sequences to each sample. Briefly, sonication of 1.0 µg tumor DNA samples was performed using a Covaris S220 sonicator (Massachusetts, USA) to generate fragments with an average size of 350 bp. Subsequently, the DNA fragments were end-polished and ligated with the full-length adapter for Illumina sequencing, followed by further Polymerase Chain Reaction (PCR) amplification. After the DNA was purified using SPRI beads from Agencourt, the libraries were analyzed for size distribution by an Agilent 2100 Bioanalyzer and quantified by real-time PCR. The DNA libraries were sequenced on an Illumina HiSeq X platform, generating 150 bp paired-end reads. All sequence reads were assessed for quality, including removal of the adaptors, the reads that had more than 10% of “N”, and the read pair that had quality of less than 5 in more than 50% of bases.
Sequencing mapping
The first stage of mapping was performed by aligning sequence reads to the human reference genome hg19 using the BWA program (11). The unmapped sequence reads were extracted from the BWA bam files. For taxonomy profiling, the NCBI blast/db/ref_prok_rep_genomes was downloaded (10,050 completed bacterial genomes on April 27, 2018). BWA was used to map the unmapped reads (fastq files) on this reference genome database. For gene functional profiling, these unmapped reads were then converted from fastq to fasta sequences files. The fasta DNA sort sequence reads were searched against the Bacterial RefSeq protein (blast/db/nr) database downloaded from NCBI using blastx algorithm by Diamond program (12).
Microbiota profiling
Megan version 6 (13) was used for microbiota and microbiome profiling analysis. The SAM files from prokaryotic genome mapping were input into Megan 6 for taxonomic profiling. The Megan program loaded in the complete NCBI taxonomy, currently containing >280,000 taxa. The DAA files generated from Blastx of the Diamond program were input into Megan 6 for microbiome function analysis. The lowest common ancestor (LCA) algorithm assigned every read to a taxon. If a read has significant matches to two different taxa at different taxa levels, the match to the ancestor is discarded and only the more specific match is used. The gene functional annotation databases, evolutionary genealogy of genes: Non-supervised Orthologous Groups (ggNOG) and SEED were provided with the Megan 6 software (14,15).
Microbiota diversity analysis
We ran QIIME2 program (16) on Microsoft Azure cloud server for microbiota diversity analysis. The microbiota profile matrix table, eggNOG and SEED function annotation matrix tables were exported from Megan 6 analysis. These feature tables were then converted to BIOM format using Bioconductor package Biomformat (17). We then used the QIIME2 program to generate QZA files from the biom files and perform the following command lines for microbiota and microbiome diversity analyses: qiime diversity core-metrics, qiime diversity, α-group-significance, qiime diversity β-group-significance, qiime composition add-pseudocount qiime composition ancom.
Diversity analysis statistics
We applied α and β diversity statistics implemented in QIIME2 package to compare community at both the microbiota and microbiome levels. For α diversity, we counted the number of distinguishable taxa (OUT’s) in each sample as species richness. For β diversity we used following statistics as described in Supplemental methods: Jaccard similarity index, Bray Curtis dissimilarity, UniFrac distance, Principal Coordinates Analysis (PCoA), Evenness index, Krustal-Wallis, and ANOVA analyses.
Results
Patients and sequencing statistics
Fifteen tissue samples were resected from 5 patients, each having two GGNs and one normal control. All tumor specimens were reviewed by pathologists independently to determine their histological subtype according to the International Association for the Study of Lung Cancer (IASLC), the American Thoracic Society (ATS), and the European Respiratory Society (ERS) lung AD classification (18). Detailed clinical features are summarized in Table 1. All five patients were females and non-smokers. For patients p1, p2, and p3, the two GGNs were resected from different ipsilateral lobes (the upper or lower lobes). For patients, p4 and p5, the two GGNs were collected from the same lobes.

Full table
We performed whole genome sequencing (WGS) on these 15 samples. In total, we obtained 3,139×10−9 bases of data or 21×10−9 150bp paired-end reads, which were mapped on a reference genome. Each tumor sample had an average of 10 million reads that were not mapped to the human reference genome, 53% of which were mapped on prokaryotic reference genomes, with the exception of the AAH2 and AIS2 samples that had 5~7% of reads mapped on prokaryotic reference genomes (Table 2).

Full table
Microbiota in GGNs
We mapped the filtered sequence reads on NCBI prokaryotic genomes RefSeq and performed the taxonomic profiling using the Megan program (13). We defined the core member of GGN microbiota to be one that is observed in 100% of samples, regardless of the relative abundance. The core GGN microbiota was shown at the phylum, class, order, family, genus, and species taxonomic ranks (Figure 1). The phylum level included Firmicutes and Actinobacteria. At the genus level, the core lung tissue microbiota included Mycobacterium, Corynebacterium, and Negativicoccus. In order to examine the cause for low mapped reads in samples AAH2 and AIS2, we compared the microbiota and the total mapped reads in each sample. Interestingly, a strong negative correlation (Pearson r=−0.84) was found between mapping percentage and the number of species taxa (Figure S1). Further study will be performed to verify if antagonism of multiple bacteria exists in GGNs.


We next examined the microbiota community diversity in each GGN sample. The top 10 bacteria taxonomies were showed. Negativicoccus demonstrated the most richness amongst all samples, followed by Mycobacterium and Corynebacterium (Figure S2). Based on the microbiota composition, we compared the β diversity among patients. However, the principal co-ordinate analysis (PCoA) showed no classification among patient samples (Figure 2). The permutation ANOVA test did not show significance of the microbiota community among patients’ samples (Table S1).


Full table
Microbiome gene functions in GGNs
Using the filtered sequence reads to map the NCBI RefSeq non-redundant protein sequences, we first predicted gene functions based on the eggNOG (14) database for the most abundant modules. eggNOG is a database of orthologous groups of genes. In the eggNOG annotation, the top abundant modules included Amino Acid Transport and Metabolism, Transcription, Replication, Energy Production and et cetera (Figure S3). The composition of eggNOG modules in each sample is shown in Figure 3. PCoA showed a slight separation of patients 1 and 2 from patients 3, 4, and 5 (Figure S4). The composition evenness showed a significant difference among all patient groups (Kruskal-Wallis test, P=0.039). The pairwise of p1 or p2 versus p3 or p4, and p3 versus p5 are significant (P<0.05) (Figure 4, Table S2).


Full table
We used the SEED database to annotate the mapped sequence reads. SEED is made up of subsystems representing the collection of functional roles (for example, a metabolic pathway), or a complex (15). The group of Amino Acids and Derivatives and group of Cofactors, Vitamins, Prosthetic Groups, and Pigments are the top subsystems. However, the 15 samples were not clustered into patients or GGNs by the SEED subsystem composition z-scores (Figure 5A). Neither PCoA or bray curtis distance test show significance among patients (Figure S5).


Microbiota between GGN nodules and adjacent normal tissues
We included data from 10 tumor samples for comparison with adjacent normal tissues. The normal tissues were resected from the same patient lung lobe as the corresponding GGN. We first tested the significance of Jaccard distance between GGNs and normal sample by permutation. Only the AD showed significant difference to NOR samples (P=0.047) (Table S3). This difference can also be seen from the PCoA view (Figure 2).

Full table
Gene functions between GGN nodules and adjacent normal tissues
We examined the eggNOG annotation between GGNs and normal samples. The Jaccard distance permutation test did not show significance between all GGN types and normal samples except an intermediate significance (P=0.096) between AIS and normal samples (Table S4). In PCoA analysis, four normal samples were separated from other GGNs (Figure S6); however, the test was not significant since the other normal sample from patient p5 was dispersed far away.

Full table

We examined the SEED annotation. There was no significantly difference between normal lung tissue samples and various GGN samples by Jaccard distance permutation test and PCoA. However, when we examined the individual SEED subsystems, the Secondary Metabolism pathway was significantly different between GGNs and normal samples (Figure 5B, fold change 1.32 with P value 0.001). In the eggNOG annotation, the COG0515 Serine Threonine protein kinase in GGNs was significantly higher than in normal control tissues (Figure 5B, fold change 4.23, P=0.01).
Discussion
Several studies of the microbiota of healthy and chronic obstructive pulmonary disease (COPD)-affected lungs from bronchoalveolar lavage (BAL) or sputum have been described using molecular methods (19-25). The COPD bronchial and lung tissue microbiota are very similar and consisted of Streptococcus, Corynebacterium, Alloiococcus, Prevotella, Veillonella, and Rothia (26). In this study, we sequenced the whole genome from the GGN nodule tissues. We did not find the common lung microbiota Streptococcus; however, we found Mycobacterium, Corynebacterium, and Negativicoccus as core microbiota existing in all GGNs and normal lung control tissues.
Infections with certain viruses, bacteria, and parasites have been identified as strong risk factors for specific cancers; and 16.1% of cancers are attributable to infections, although the contribution due to infection varies widely from region to region (27). Specific to China, tuberculosis (TB) is still an important health threat, accounting for 11% of the TB burden in the world (28). There is now epidemiologic evidence that pre-existing TB poses an increased lung cancer risk (29-31). Interestingly, Mycobacterium was discovered in GGNs. Mycobacterium tuberculosis and Mycobacterium avium complex (MAC) are considered to play a potential role in oncogenesis (32). Unexpectedly high rates of lung cancer among individuals were reported with prior or concurrent MAC lung infection (32). Coexistence of M. xenopi with lung cancer has been reported. In a recent population-based study of patients with pulmonary nontuberculous mycobacterial disease, 6.5% of the patients also had lung cancer (33). The persistence of mycobacterial organisms in the lung can stimulate a proinflammatory response to local tissue (34,35). Local inflammation triggers the release of factors that can support the outgrowth of premalignant cells (36).
In the gene function eggNOG annotation, the COG0515 Serine Threonine protein kinase in GGNs was significantly higher than in normal control tissues (fold change 4.23, P<0.001). Recent advances in genetic strategies and genome sequencing have revealed the existence of “eukaryotelike” serine/threonine protein kinases (STPKs) in a number of prokaryotic organisms, including Streptococcus spp, Mycobacterium, Yersinia spp, Listeria monocytogenes, Pseudomonas, Enterococcus faecalis, and Staphylococcus aureus (37-43). Bacterial serine/threonine protein kinase (STPK) family phosphorylates a host substrate or the host defense is disrupted by STPK activity. In the SEED annotation, the bacterial Secondary Metabolism in GGNs is significantly higher than in normal control tissues (fold change 1.32, P=0.01). Microbial Secondary Metabolism pathway produces secondary metabolites, such as pigments, alkaloids, toxins, antibiotics, gibberellins, carotenoids that serve no obvious function in the life of organisms that produce them. These secondary metabolites could form a microenvironment that affects the local host responses or initiate tumorigenesis.
Despite the limitations of small sample size, we described the taxonomic and functional profiles of microbiota in lung AD presented as GGN. A concern is that our lung tissue assays might be contaminated during DNA extraction, PCR amplification, or sequencing. As recently reviewed by Eisenhofer et al. (44), the contamination could be an issue in metagenomics analysis for low-biomass specimen such as lung specimen. Similar to many previous microbiome studies, we did not design proper positive and negative controls to estimate the contamination. However, the procedure we used to handle the samples would have greatly reduced the chance of cross-contamination or environment contamination. Mycobacterium, one of the top taxa previously not seen in the reported contaminated taxa list (44), unlikely came from environment contamination. As a first report in GGN microbiome using a WGS approach, this study can gain further verification using 16S rRNA metagenomics on a large sample size and can be a valuable reference for future studies.
We speculate that cumulative exposure to air pollutants or life style conditions altered the lung microbiota which may contribute to the initiation of GGNs, though it was not tested in this study yet. Air pollutants are the atmospheric particulate matters (PM) that are 2.5 to 10 micrometers in diameter (PM10) and are in 2.5 micrometers or less (PM2.5). In 2005, the number of lung cancer deaths attributable to PM2.5 in China was 51,200, accounting for 13.7% of the overall death due to lung cancer (45). The change of atmospheric composition has an influence on the microbiota diversity, even disordered the microbial communities according to previous studies (46-48). Our results advocate for further studies on the relationship of air pollution and the lung microbiome, as well as the contribution of heavy air pollution to the increased GGN and lung cancer incidence in China.
Collectively, this study first investigated the microbiome in GGNs using WGS and found core microbiota (Mycobacterium, Corynebacterium, and Negativicoccus) in GGNs. The Secondary Metabolism pathway and Serine Threonine protein kinase were increased in GGNs. Though the sample size was small and contamination controls were not designed, the sample resections performed in a sterile environment and the molecular experiment procedure largely reduced the chances of contamination. These discoveries may gain further verification in future studies using 16S rRNA metagenomics for a larger sample size. Our study shed a light that lung microbiome may contribute to the development of GGNs, particularly in regions with heavy air pollutions.
Supplementary
Methods and statistics
We applied α and β diversity statistics implemented in QIIME2 package to compare community at both the microbiota and microbiome levels. For α diversity, we count the number of distinguishable taxa (OUT’s) in each sample as species richness. For β diversity we used following statistics:
- The Jaccard similarity index or the Jaccard similarity coefficient is a measure of similarity for the two sets of data, with a range from 0% to 100%. The higher the percentage, the more similar the two populations.
- The Bray Curtis dissimilarity is to quantify the differences between two sets.
- UniFrac incorporates information on the relative relatedness of community members by incorporating phylogenetic distances between observed organisms in the computation.
- Principal Coordinates Analysis (PCoA) explores and visualizes similarities or dissimilarities of data. It uses a similarity matrix or dissimilarity matrix and assigns to find the main axes through a matrix. It is a kind of eigenanalysis and calculates a series of eigenvalues and eigenvectors.
- Evenness index is a measure of biodiversity of a community. The evenness of a community can be represented by Pielou’s evenness index:
- Evenness test by Krustal-Wallis and ANOVA analyses. In the ANOVA, we assume that the dependent variable is normally distributed and there is approximately equal variance on the scores across groups. The Kruskal-Wallis test is a nonparametric (distribution free) test, and is used when the assumptions of one-way ANOVA are not met. We do not have to make any of these assumptions when using the Kruskal-Wallis Test.
Jaccard Index = (the number in both sets)/(the number in either set) ×100
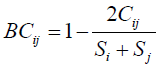
Where: i & j are the two sites; Si is the total number of specimens counted on site I; Sj is the total number of specimens counted on site j; Cij is the sum of only the lesser counts for each species found in both sites.
J’ = H’/H’max. Where H’is the number derived from the Shannon diversity index and H’max is the maximum possible value of, equal to:
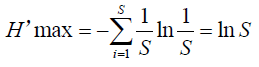
J’ is constrained between 0 and 1. The less evenness in communities between the species (and the presence of a dominant species), the lower J’ is. And vice versa. S is the total number of species.
Acknowledgments
Funding: This project is funded by Shanghai Hospital Development Center (SHDC12015116), Shanghai Lingjun Program (2015057), National Key R&D Program of China (2016YFC0905402), Shanghai Pujiang Program (15PJD034) and Shanghai Pulmonary Innovation group (FKCX1906). This study is also partially supported by CancerCare Manitoba Foundation (CCMF) grant (W Xu).
Footnote
Conflicts of Interest: The authors have no conflicts of interest to declare.
Ethical Statement: This study was carried out in accordance with the principles of the Helsinki Declaration of the World Medical Association. The study was approved by the institutional Ethics Committee of the Shanghai Pulmonary Hospital. The authors are accountable for all aspects of the work in ensuring that questions related to the accuracy or integrity of any part of the work are appropriately investigated and resolved.
References
- National Lung Screening Trial Research T, Aberle DR, Adams AM, et al. Reduced lung-cancer mortality with low-dose computed tomographic screening. N Engl J Med 2011;365:395-409. [Crossref] [PubMed]
- Yoshihara K, Wang Q, Torres-Garcia W, et al. The landscape and therapeutic relevance of cancer-associated transcript fusions. Oncogene 2015;34:4845-54. [Crossref] [PubMed]
- Ren Y, Huang S, Dai C, et al. Germline Predisposition and Copy Number Alteration in Pre-stage Lung Adenocarcinomas Presenting as Ground-Glass Nodules. Front Oncol 2019;9:288. [Crossref] [PubMed]
- Brunkwall L, Orho-Melander M. The gut microbiome as a target for prevention and treatment of hyperglycaemia in type 2 diabetes: from current human evidence to future possibilities. Diabetologia 2017;60:943-51. [Crossref] [PubMed]
- Kostic AD, Xavier RJ, Gevers D. The microbiome in inflammatory bowel disease: current status and the future ahead. Gastroenterology 2014;146:1489-99. [Crossref] [PubMed]
- Tsai F, Coyle WJ. The microbiome and obesity: is obesity linked to our gut flora? Curr Gastroenterol Rep 2009;11:307-13. [Crossref] [PubMed]
- Mima K, Nakagawa S, Sawayama H, et al. The microbiome and hepatobiliary-pancreatic cancers. Cancer Lett 2017;402:9-15. [Crossref] [PubMed]
- Vogtmann E, Goedert JJ. Epidemiologic studies of the human microbiome and cancer. Br J Cancer 2016;114:237-42. [Crossref] [PubMed]
- Mao Q, Jiang F, Yin R, et al. Interplay between the lung microbiome and lung cancer. Cancer Lett 2018;415:40-8. [Crossref] [PubMed]
- Detterbeck FC, Bolejack V, Arenberg DA, et al. The IASLC Lung Cancer Staging Project: Background Data and Proposals for the Classification of Lung Cancer with Separate Tumor Nodules in the Forthcoming Eighth Edition of the TNM Classification for Lung Cancer. J Thorac Oncol 2016;11:681-92.
- Li H, Durbin R. Fast and accurate short read alignment with Burrows-Wheeler transform. Bioinformatics 2009;25:1754-60. [Crossref] [PubMed]
- Buchfink B, Xie C, Huson DH. Fast and sensitive protein alignment using DIAMOND. Nat Methods 2015;12:59-60. [Crossref] [PubMed]
- Huson DH, Beier S, Flade I, et al. MEGAN Community Edition - Interactive Exploration and Analysis of Large-Scale Microbiome Sequencing Data. PLoS Comput Biol 2016;12:e1004957. [Crossref] [PubMed]
- Jensen LJ, Julien P, Kuhn M, et al. eggNOG: automated construction and annotation of orthologous groups of genes. Nucleic Acids Res 2008;36:D250-4. [Crossref] [PubMed]
- Overbeek R, Begley T, Butler RM, et al. The subsystems approach to genome annotation and its use in the project to annotate 1000 genomes. Nucleic Acids Res 2005;33:5691-702. [Crossref] [PubMed]
- Caporaso JG, Kuczynski J, Stombaugh J, et al. QIIME allows analysis of high-throughput community sequencing data. Nat Methods 2010;7:335-6. [Crossref] [PubMed]
- McDonald D, Clemente JC, Kuczynski J, et al. The Biological Observation Matrix (BIOM) format or: how I learned to stop worrying and love the ome-ome. Gigascience 2012;1:7. [Crossref] [PubMed]
- Travis WD, Brambilla E, Noguchi M, et al. International association for the study of lung cancer/american thoracic society/european respiratory society international multidisciplinary classification of lung adenocarcinoma. J Thorac Oncol 2011;6:244-85. [Crossref] [PubMed]
- Charlson ES, Bittinger K, Haas AR, et al. Topographical continuity of bacterial populations in the healthy human respiratory tract. Am J Respir Crit Care Med 2011;184:957-63. [Crossref] [PubMed]
- Dickson RP, Erb-Downward JR, Freeman CM, et al. Spatial Variation in the Healthy Human Lung Microbiome and the Adapted Island Model of Lung Biogeography. Ann Am Thorac Soc 2015;12:821-30. [Crossref] [PubMed]
- Dickson RP, Erb-Downward JR, Freeman CM, et al. Bacterial Topography of the Healthy Human Lower Respiratory Tract. MBio 2017.8. [PubMed]
- Erb-Downward JR, Thompson DL, Han MK, et al. Analysis of the lung microbiome in the "healthy" smoker and in COPD. PLoS One 2011;6:e16384. [Crossref] [PubMed]
- Garcia-Nuñez M, Millares L, Pomares X, et al. Severity-related changes of bronchial microbiome in chronic obstructive pulmonary disease. J Clin Microbiol 2014;52:4217-23. [Crossref] [PubMed]
- Hilty M, Burke C, Pedro H, et al. Disordered microbial communities in asthmatic airways. PLoS One 2010;5:e8578. [Crossref] [PubMed]
- Pragman AA, Kim HB, Reilly CS, et al. The lung microbiome in moderate and severe chronic obstructive pulmonary disease. PLoS One 2012;7:e47305. [Crossref] [PubMed]
- Pragman AA, Lyu T, Baller JA, et al. The lung tissue microbiota of mild and moderate chronic obstructive pulmonary disease. Microbiome 2018;6:7. [Crossref] [PubMed]
- de Martel C, Ferlay J, Franceschi S, et al. Global burden of cancers attributable to infections in 2008: a review and synthetic analysis. Lancet Oncol 2012;13:607-15. [Crossref] [PubMed]
- Zumla A, George A, Sharma V, et al. The WHO 2014 global tuberculosis report--further to go. Lancet Glob Health 2015;3:e10-2. [Crossref] [PubMed]
- Ho JC, Leung CC. Management of co-existent tuberculosis and lung cancer. Lung Cancer 2018;122:83-7. [Crossref] [PubMed]
- Liang HY, Li XL, Yu XS, et al. Facts and fiction of the relationship between preexisting tuberculosis and lung cancer risk: a systematic review. Int J Cancer 2009;125:2936-44. [Crossref] [PubMed]
- Yu YH, Liao CC, Hsu WH, et al. Increased lung cancer risk among patients with pulmonary tuberculosis: a population cohort study. J Thorac Oncol 2011;6:32-7. [Crossref] [PubMed]
- Lande L, Peterson DD, Gogoi R, et al. Association between pulmonary mycobacterium avium complex infection and lung cancer. J Thorac Oncol 2012;7:1345-51. [Crossref] [PubMed]
- Souilamas R, Danel C, Chauffour X, et al. Lung cancer occurring with Mycobacterium xenopi and Aspergillus. Eur J Cardiothorac Surg 2001;20:211-3. [Crossref] [PubMed]
- Marras TK, Daley CL. Epidemiology of human pulmonary infection with nontuberculous mycobacteria. Clin Chest Med 2002;23:553-67. [Crossref] [PubMed]
- Peek RM Jr, Mohla S, DuBois RN. Inflammation in the genesis and perpetuation of cancer: summary and recommendations from a national cancer institute-sponsored meeting. Cancer Res 2005;65:8583-6. [Crossref] [PubMed]
- Coussens LM, Werb Z. Inflammation and cancer. Nature 2002;420:860-7. [Crossref] [PubMed]
- Galyov EE, Hakansson S, Forsberg A, et al. A secreted protein kinase of Yersinia pseudotuberculosis is an indispensable virulence determinant. Nature 1993;361:730-2. [Crossref] [PubMed]
- Jin H, Pancholi V. Identification and biochemical characterization of a eukaryotic-type serine/threonine kinase and its cognate phosphatase in Streptococcus pyogenes: their biological functions and substrate identification. J Mol Biol 2006;357:1351-72. [Crossref] [PubMed]
- Kristich CJ, Wells CL, Dunny GM. A eukaryotic-type Ser/Thr kinase in Enterococcus faecalis mediates antimicrobial resistance and intestinal persistence. Proc Natl Acad Sci U S A 2007;104:3508-13. [Crossref] [PubMed]
- Lima A, Duran R, Schujman GE, et al. Serine/threonine protein kinase PrkA of the human pathogen Listeria monocytogenes: biochemical characterization and identification of interacting partners through proteomic approaches. J Proteomics 2011;74:1720-34. [Crossref] [PubMed]
- Molle V, Kremer L. Division and cell envelope regulation by Ser/Thr phosphorylation: Mycobacterium shows the way. Mol Microbiol 2010;75:1064-77. [Crossref] [PubMed]
- Truong-Bolduc QC, Hooper DC. Phosphorylation of MgrA and its effect on expression of the NorA and NorB efflux pumps of Staphylococcus aureus. J Bacteriol 2010;192:2525-34. [Crossref] [PubMed]
- Wang J, Li C, Yang H, et al. A novel serine/threonine protein kinase homologue of Pseudomonas aeruginosa is specifically inducible within the host infection site and is required for full virulence in neutropenic mice. J Bacteriol 1998;180:6764-8. [PubMed]
- Eisenhofer R, Minich JJ, Marotz C, et al. Contamination in Low Microbial Biomass Microbiome Studies: Issues and Recommendations. Trends Microbiol 2019;27:105-17. [Crossref] [PubMed]
- Guo Y, Zeng H, Zheng R, et al. The burden of lung cancer mortality attributable to fine particles in China. Sci Total Environ 2017;579:1460-6. [Crossref] [PubMed]
- Charlson ES, Chen J, Custers-Allen R, et al. Disordered microbial communities in the upper respiratory tract of cigarette smokers. PLoS One 2010;5:e15216. [Crossref] [PubMed]
- Kloog I, Sorek-Hamer M, Lyapustin A, et al. Estimating daily PM2.5 and PM10 across the complex geo-climate region of Israel using MAIAC satellite-based AOD data. Atmos Environ (1994) 2015;122:409-16. [PubMed]
- Yu G, Gail MH, Consonni D, et al. Characterizing human lung tissue microbiota and its relationship to epidemiological and clinical features. Genome Biol 2016;17:163. [Crossref] [PubMed]

