
The use of TCP based EUD to rank and compare lung radiotherapy plans: in-silico study to evaluate the correlation between TCP with physical quality indices
Introduction
The objective of radiation oncology is to increase the local cure rates of tumor, which typically depend on the delivered dose. The dose distribution, in the tumor or organ at risks, is calculated by specific dose calculation algorithms. Based on the predicted dose distribution, radiobiological models are able to estimate the tumor control probability (TCP). These models are multiple and based on different mathematical and statistical concepts. Some of them are directly available in the treatment planning systems (TPS), which are used to calculate the dose distribution (1-7). However, several precautions should be observed for a safe use of these TCP models to predict radiotherapy outcomes. Firstly, a variability of radiobiological parameters setting is assumed for each cancer site. However, the validity of TCP prediction is stills questionable due to the variability of theses parameters in the literature. Secondly, there are successive generations of dose calculation algorithms and the available clinical data are mostly based on the type ‘A’ algorithms (e.g., density correction methods associated with pencil beam convolution). Nevertheless, the more recent algorithms, as types ‘B’ or ‘C’, respectively, such as anisotropic analytical algorithm (AAA) or Acuros-XB implemented in Eclipse® TPS (Varian Medical Systems, Palo Alto, CA, USA), are recommended (8). As previously mentioned, several studies have recently been performed, which investigated radiobiological models to estimate radiotherapy outcomes. However, thus far no study has been performed to investigate the radiobiological parameter settings to quantify the uncertainties of TCP prediction for the same patient due to the variability of these parameters, and to make the right medical decision. The primary aim of this work is to evaluate differences in TCP scores for treatment plans using different radiobiological parameter setting, and to determine how the TCP correlates with dose volume histograms (DVH) indices. The TCP was calculated with equivalent uniform dose (EUD) model.
Methods
Clinical cases and treatment planning
This study is based on ten radiotherapy treatment plans for lung tumors. A computed tomography (CT-scan) was carried out for each patient, and then the images were loaded into Eclipse® TPS. The dose distribution was calculated with AAA (9,10). The algorithm was integrated in version 10.0 of Varian Eclipse™ TPS. The target volumes and the organs at risk were delineated by the radiation oncologist. Prescribed dose (PD) ranged from 50 to 66 Gy, with median of 57 Gy, 2 Gy per daily fraction. The virtual simulation for each patient was generated by a Digitally Reconstructed Radiograph (DRR) and beam’s eye view images. Next, treatment fields were superimposed on the DRR to assess the well adjustment to targets. The treatments were performed with 5 to 8 beams.
Dose calculation assessment
DVH
For each planning target volume (PTV) the minimum dose (Dmin), mean dose (Dmean), maximum dose (Dmax) and the calculated dose to 95% of the target volume (D95%) were extracted from cumulative DVH. The dose homogeneity inside the target was assessed using a S-index associated with the differential DVH (dDVH):
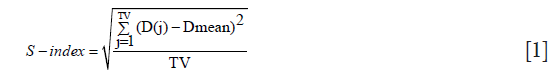
where D(j) is the relative dose in the lesion voxel j, Dmean is the average relative dose in the lesion and TV is the target volume in elementary voxels (11).
Plan indices evaluation
High precision about DVH calculation and radiotherapy outcomes are needed to rank and compare treatments plans from the different radiotherapy modalities. In this study, we used the following indices (12-14):
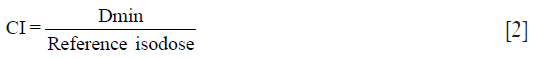
Coverage index (CI):
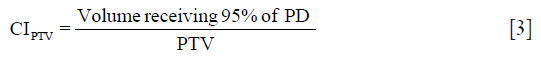
Target Conformity Index for the target volume (CITV):
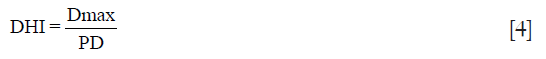
Dose homogeneity index (DHI): DHI scales the hot spots in and around the PTV, as:
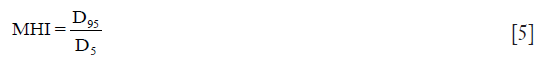
Modified dose homogeneity index (MHI) is defined as:
Quality factor (QF) of treatment plans
In order to quantify the quality of a radiotherapy treatment plans, we used a single parameter based on quality indices, named the overall QF. The QF for each plan can be determined by a linear combination of all indices taken in consideration. QF can be efficiently computed for a plan by assigning the relative weights to all plan indices as a complete plan evaluation strategy. The QF of a treatment plan can be analytically expressed in terms of combination of the set of indices as given below (15):

where Wi is the values of weight factor and can be adjusted between zero to unity for all relatively weighted indices {Xi} for number of indices. In this study, a weighting factor of 1 was used for all indices (N=4).
Radiobiological TCP model and outcomes assessment
The EUD model proposed by Niemierko, 1997 was used to calculate the TCP (16-18):
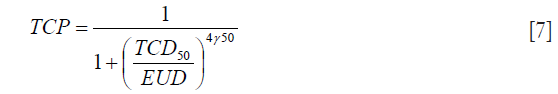
The TCD50 is the dose to control 50% of the tumors when the tumor is homogeneously irradiated. γ50 describes the slope of the dose-response curve.
EUD is calculated as:
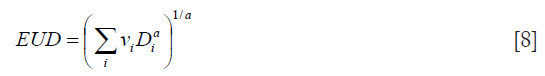
where “vi” is the fractional organ volume receiving a dose “Di” and “a” is a tissue-specific parameter that describes the volume effect. In this study, the value of “a” was equal to [−10]. The parameters for TCD50, and γ50 were taken from Okunieff’s report (19). For comparative purposes, the assumed values for TCD50 and γ50 for adjuvant radiotherapy and curative intent were investigated to evaluate the correlation of TCP-values with physical indices from DVH. For adjuvant radiotherapy, the TCD50 and γ50 were respectively 36.5 Gy and 0.72. For curative intent, the TCD50 and γ50 from multi-institutional analysis were respectively 51.24 Gy and 0.83.
Statistical analysis
The physical indices derived from DVH and TCP-EUD were included in the analysis. A bootstrap simulation method with 1,000 random samplings was used to calculate the 95% confidence interval (95% CI) (20). The correlation coefficients (ρ) from Spearman’s rank correlation test were analyzed to assess the correlation between physical indices with TCP. The Wilcoxon signed rank test was used to calculate the P value.
Results
TCP outcome
The 95% CI for TCP scores were 70.6–81.5 and 46.6–64.7 respectively for adjuvant radiotherapy and curative intent. The Figure 1 presents the 95% CI for TCP values from bootstrap simulation with 1,000 random samplings. It can be seen that the choice of parameters TCD50 significantly modify the TCP scores, with P=0.03.

Correlation between TCP with physical indices data
The correlation coefficients (ρ) from Spearman’s test were analyzed. We observed a good correlation between estimated TCP and physical indices derived from DVH. A similar correlation between EUD and the commonly DVH parameters was also observed. Table 1 shows the (ρ) values, from Spearman’s test. It can be seen that a strong correlation between TCP with Dmin, as well as TCP with D95%.

Full table
Correlation between TCP and EUD
Figure 2 shows an example of dDVH with homogenous dose distribution in plan 1 and heterogeneous dose distribution in plan 2, using a prescription dose of 60 Gy. It can be seen higher values for Dmin, D95% and V95% with plan 1 leading to more EUD/TCP. The EUDs were 59.7 and 57.3 Gy, respectively in plans 1 and 2. In this specific case, the TCPs in plan 1 were 80% and 62% respectively, for adjuvant radiotherapy and curative intent. The TCPs in plan 2 were 78% and 59% respectively for adjuvant radiotherapy and curative intent. It can be seen also the dose is most uniform with lower S-index (0.9 Gy in plan 1 vs. 2.1 Gy in plan 2). However, to conclude the best plan one should to consider both tumor and normal tissue DVH. For target the best plan should include a Dmin close to PD, a higher value for D95% and V95% as well as coverage and conformity indices close to one while minimizing inhomogeneity dose distribution. For normal tissues, the best plan includes DVH with lower maximum and mean doses and low volume of normal tissues receiving doses close to tolerance threshold.

Impact of radiobiological parameter setting on TCP metrics
Figure 3 shows the impact of TCD50 ranging from 35 to 55 Gy on TCP metrics. Figure 4 shows the impact of tissue specific parameter on TCP/EUD metrics for adjuvant radiotherapy and curative intent.


Discussion
Numerous studies have investigated the TCP based on the linear-quadratic (LQ) model of cell kill to compare and rank radiotherapy plans. They also studied the impact of radio-sensitivity parameter of the LQ on TCP. They reported that LQ model could be used to rank and optimize radiotherapy plans (21-25). In this article, we conducted a new study about the sensitivity of TCP-EUD, for the same patient, on the different radiobiological parameters. In addition, we evaluated the correlation between TCP-EUD with physical parameters from DVH to provide a rapid and safely new method to rank and compare radiotherapy plans. We observed that, the predicted TCP was significantly sensible to TCD50 and specific tissue parameter “a”. Thus, more information about cancer type and treatments are necessary to choose the more accurate biological model parameters. However, as expected, the TCP is depending on DVH since the TCP was calculated using all data from DVH (Di, vi). A strong correlation was observed between TCP and tumor coverage. As results, the choice of radiobiological parameter setting or dose calculation algorithm to compare and rank radiotherapy plans is a very important point of view.
Precaution to use TCP in order to rank and optimize radiotherapy plans
To obtain a better TCP using EUD model, the value of EUD should be close to prescription dose and the inhomogeneity dose distribution on the PTV should be very lower. As we can see in the Table 1, negative correlation between TCP and S-index, DHI or MHI. The maximizing TCP and EUD may be produce a considerable inhomogeneous dose distributions “hot spots” in the target or healthy tissues. Thus, the use of TCP alone to take a medical decision can introduce “hot spots” by increasing V105% or V107% for the target and spread more dose for OARs. An attention should be paid using EUD optimization method to avoid the over irradiation of OARs. To consider the dose inhomogeneity, one can constrain the hot spots to the gross tumor volume or clinical target volume, as well as an adjustment for tissue specific parameter (7). Generally, “a” describes the volume effect, negative “a” values are an appropriate choice for targets, positive “a” values should be used for serial structures, and a =1 should be used for parallel structures. To mimic the effects of cold spots on TCP, the specific tissue parameter is taken as negative (a=−10) for tumors (7,26,27) and to consider “hot spots” in the TCP calculation, “a” can be adjusted for photon and particle therapy.
A more incertitude and weakness can be observed in the choice of dose calculation algorithms. The limits of this study are the dose calculation algorithm and radiobiological model. AAA is much more modern engine, it is also not near to “reference standard” such as monte carlo (MC) which model all the primary and secondly interactions. More recent studies showed that AAA overestimates the PTV dose and TCP compared to Acuros-XB using Poisson model with LQ. The difference can be reached up to 5.8% for TCP, while both algorithms yield very similar normal tissue complication probability (NTCP) on lung pneumonitis based on the LKB model parameter (28,29). However, the more advanced algorithms such as AAA, Acrous-XB, collapsed cone and MC would be recommended to better calculate the dose for tumor and to avoid the over/under estimating TCP/NTCP outcome. We also advice a caution when a clinical decision based on TCP models would be taken. The TCP models in the literature simplify of the complex reality of the dynamics of irradiated tumors. The EUD model, used in this study, is a purely empirical one basically a sigmoidal curve and the dose function. On the other hand, the EUD model contains few radiobiological parameters such as “a”, in contrast to Poisson model which well-established LQ model of cell killing. Zaider et al., showed that there are numerous important factors that determine tumor response to radiation, such as cell cycling, interaction with the immune system, selection effects, spatial heterogeneity of the tumor and its capillary network, etc. (30) have not been taken into account using LQ-Poisson model. However, the EUD has the advantage of fewer model parameters compared to another TCP or NTCP models, and allows more clinical flexibility. A good calibration for radiobiological parameter setting can provide a better estimation of TCP and NTCP to rank and compare treatment plans and help the clinician or radio-physicists to select the best treatment with photon or proton therapy.
Conclusions
In this study, we evaluated and quantified the correlation between TCP outcome form EUD model and physical indices resulting from DVH. The choice of radiobiological parameter setting could over/under estimate the TCP-values. It is important to use TCP parameter sets based on calculations and treatments similar to those for which the TCP has to be calculated; additionally, it is necessary to improve models and obtain more robust clinical related radiobiological parameters.
Acknowledgements
Funding: This research is contributing to the ProtonShare project, and is partially supported by the French research funding agency, Agence Nationale de la Recherche, in the frame of the “Investments for the Future” under the reference: France HADRON, ANR-11-INBS-0007.
Footnote
Conflicts of Interest: The authors have no conflicts of interest to declare.
Ethical Statement: The authors declare that the article does not require a Statement of Ethics, since all the clinical material was anonymized CT-scans images used for dosimetric repeated assay’s at a remote time from the real treatment of the patients as mentioned in (2.1 Treatment plans section). Absolutely no information concerning the patients, them self, were used, so no consent was necessary. The study has been carried out in the University Hospital of Grenoble, France.
References
- Zaider M, Minerbo GN. Tumour control probability: a formulation applicable to any temporal protocol of dose delivery. Phys Med Biol 2000;45:279-93. [Crossref] [PubMed]
- Bentzen SM, Tucker SL. Quantifying the position and steepness of radiation dose-response curves. Int J Radiat Biol 1997;71:531-42. [Crossref] [PubMed]
- Tucker SL, Taylor JM. Improved models of tumour cure. Int J Radiat Biol 1996;70:539-53. [Crossref] [PubMed]
- Martel MK, Ten Haken RK, Hazuka MB, et al. Estimation of tumor control probability model parameters from 3-D dose distributions of non-small cell lung cancer patients. Lung Cancer 1999;24:31-7. [Crossref] [PubMed]
- Fenwick JD, Nahum AE, Malik ZI, et al. Escalation and intensification of radiotherapy for stage III non-small cell lung cancer: opportunities for treatment improvement. Clin Oncol (R Coll Radiol) 2009;21:343-60. [Crossref] [PubMed]
- Nahum AE, Sanchez-Nieto B. Tumour control probability modelling: Basic principles and applications in treatment planning. Phys Med 2001;17:13-23. [PubMed]
- Allen Li X, Alber M, Deasy JO, et al. The use and QA of biologically related models for treatment planning: short report of the TG-166 of the therapy physics committee of the AAPM. Med Phys 2012;39:1386-409. [Crossref] [PubMed]
- Chaikh A, Khamphan C, Kumar T, et al. What should we know about photon dose calculation algorithms used for radiotherapy? Their impact on dose distribution and medical decisions based on TCP/NTCP. Int J Cancer Ther Oncol 2016;4:4418.
- Rana S. Clinical dosimetric impact of Acuros XB and analytical anisotropic algorithm (AAA) on real lung cancer treatment plans Int J Cancer Ther Oncol 2014;2:02019. review. [Crossref]
- Sievinen J, Ulmer W, Kaissl W. AAA photon dose calculation model in Eclipse. Palo Alto (CA): Varian Medical Systems, 2005:1-18. [RAD #7170B].
- Yoon M, Park SY, Shin D, et al. A new homogeneity index based on statistical analysis of the dose-volume histogram. J Appl Clin Med Phys 2007;8:9-17. [Crossref] [PubMed]
- Chaikh A, Giraud J, Balosso J. A method to quantify and assess the dosimetric and clinical impact resulting from the heterogeneity correction in radiotherapy for lung cancer. Int J Cancer Ther Oncol 2014;2:020110. [Crossref]
- Feuvret L, Noël G, Mazeron JJ, et al. Conformity index: a review. Int J Radiat Oncol Biol Phys 2006;64:333-42. [Crossref] [PubMed]
- Akpati H, Kim C, Kim B, et al. Unified dosimetry index (UDI): a figure of merit for ranking treatment plans. J Appl Clin Med Phys 2008;9:2803. [Crossref] [PubMed]
- Pyakuryal A, Myint WK, Gopalakrishnan M, et al. A computational tool for the efficient analysis of dose-volume histograms from radiation therapy treatment plans. J Appl Clin Med Phys 2010;11:3013. [Crossref] [PubMed]
- Niemierko A. A unified model of tissue response to radiation. In: Proceedings of the 41th AAPM annual meeting, 1999. Nashville, Tennessee: Med Phys 1999:1100.
- Niemierko A. Reporting and analyzing dose distributions: a concept of equivalent uniform dose. Med Phys 1997;24:103-10. [Crossref] [PubMed]
- Gay HA, Niemierko A. A free program for calculating EUD-based NTCP and TCP in external beam radiotherapy. Phys Med 2007;23:115-25. [Crossref] [PubMed]
- Okunieff P, Morgan D, Niemierko A, et al. Radiation dose-response of human tumors. Int J Radiat Oncol Biol Phys 1995;32:1227-37. [Crossref] [PubMed]
- Chaikh A, Giraud JY, Perrin E, et al. The choice of statistical methods for comparisons of dosimetric data in radiotherapy. Radiat Oncol 2014;9:205. [Crossref] [PubMed]
- Stavreva N, Nahum A, Markov K, et al. Analytical investigation of the possibility of parameter invariant TCP-based radiation therapy plan ranking. Acta Oncol 2010;49:1324-33. [Crossref] [PubMed]
- Stavrev P, Ruggieri R, Stavreva N, et al. Applying radiobiological plan ranking methodology to VMAT prostate SBRT. Phys Med 2016;32:636-41. [Crossref] [PubMed]
- Miften MM, Das SK, Su M, et al. A dose-volume-based tool for evaluating and ranking IMRT treatment plans. J Appl Clin Med Phys 2004;5:1-14. [Crossref] [PubMed]
- Qi SX, Li A, Kainz K, et al. Ranking Complex IMRT Plans Using an EUD-Based Figure-of-Merit Index. Int J Radiat Oncol Biol Phys 2006;66:S658. [Crossref]
- Ebert M. Ranking radiotherapy treatment plans: physical or biological objectives? Radiol Oncol 2001;35:215-24.
- Wu Q, Mohan R, Niemierko A, et al. Optimization of intensity-modulated radiotherapy plans based on the equivalent uniform dose. Int J Radiat Oncol Biol Phys 2002;52:224-35. [Crossref] [PubMed]
- De Gersem WR, Derycke S, Colle CO, et al. Inhomogeneous target-dose distributions: a dimension more for optimization? Int J Radiat Oncol Biol Phys 1999;44:461-8. [Crossref] [PubMed]
- Liang X, Penagaricano J, Zheng D, et al. Radiobiological impact of dose calculation algorithms on biologically optimized IMRT lung stereotactic body radiation therapy plans. Radiat Oncol 2016;11:10. [Crossref] [PubMed]
- Padmanaban S, Warren S, Walsh A, et al. Comparison of Acuros (AXB) and Anisotropic Analytical Algorithm (AAA) for dose calculation in treatment of oesophageal cancer: effects on modelling tumour control probability. Radiat Oncol 2014;9:286. [Crossref] [PubMed]
- Zaider M, Hanin L. Tumor control probability in radiation treatment. Med Phys 2011;38:574-83. [Crossref] [PubMed]

