

Parallel serial assessment of somatic mutation and methylation profile from circulating tumor DNA predicts treatment response and impending disease progression in osimertinib-treated lung adenocarcinoma patients
Introduction
Despite the dramatic clinical response and improvement in survival outcomes afforded by epidermal growth factor receptor (EGFR) tyrosine kinase inhibitors (TKIs) for EGFR-mutant non-small cell lung cancer (NSCLC) patients, disease progression (PD) is still inevitable (1,2). According to the revised standards of the Response Evaluation Criteria in Solid Tumors (RECIST) (version 1.1), PD is defined as either the increase of more than or equal to 20% of the sum of the longest diameter of the measurable target lesions with a 5 mm absolute increase compared with the smallest diameter recorded or the appearance of one or more new lesions (3-5). Guided by the standard criteria of RECIST (3-5), PD is morphologically evaluated by imaging modalities, including computed tomography (CT), positron emission tomography (PET), or magnetic resonance imaging (MRI). To improve the early detection of PD prior to the morphological manifestation of disease relapse, tremendous efforts have been invested in evaluating the potential of serially assessing circulating tumor DNA (ctDNA) levels from the blood to detect signs of residual disease in the molecular level (6-9). CtDNA, derived from the apoptotic and necrotic turnover of cancer cells, has been used as an alternative source of tumor DNA which is able to reflect both the intra- and inter-tumoral heterogeneity in primary and metastatic lesions (10-12). Since ctDNA is a direct reflection of tumor burden, ctDNA levels have been proposed as a noninvasive real-time biomarker to provide prognostic and predictive information (13-20). The prognostic value of assessing ctDNA levels has been well-established in detecting minimal residual disease following surgery in various cancer types including lung, colorectal, and bladder cancer, and is currently being explored in monitoring treatment responses of patients with advanced disease (13-20). In addition, numerous reports have also demonstrated the detection of methylated ctDNA and its association to prognosis after surgery (21-25). The methylation status of genes such as APC, CDKN2A, RUNX3, RARB2, MSH2, and ESR1B in esophageal (22), liver (23), gastric (24), and breast cancer (25), respectively, has been associated with residual tumor after surgery and prognosis. In addition to its potential as a prognostic marker, monitoring of methylated ctDNA can also predict response to therapy. The ctDNA methylation status of APC, RASSF1A, RARB2, and SHOX2 has been correlated with treatment efficacy, and these have potential as a biomarker for predicting treatment response in advanced lung cancer (26,27).
Genome-wide studies on almost every cancer type have effectuated profound changes in the understanding of DNA methylation profiles (28,29). DNA methylation, which plays an important role in both normal development and tumorigenesis, is defined as a covalent addition of a methyl group to the 5’ position of cytosine residues in CpG dinucleotides (30). CpG refers to cytosine (C) followed immediately by a guanine (G) nucleotide, with the two linked by a phosphate bond. The methylation of gene promoters results in gene silencing by altering the accessibility of the DNA to transcription factors which help recruit silencing-associated proteins (31). This disruption of DNA methylation can lead to altered gene function and cellular transformation, and the role of aberrant DNA methylation in the process of tumorigenesis both of individual genes and those on a genome-wide scale has been well-elucidated (32-35). It is understood that cancer cells harbor a global hypomethylation (loss of methylation) and regional hypermethylation (gain of methylation) status, particularly in CpG-rich regions (29,34,36). DNA hypomethylation often occurs at repeating elements, retrotransposons, CpG poor promoters, introns, and gene deserts, leading to increased genomic instability and the activation of proto-oncogenes (37). In contrast, regional hypermethylation primarily occurs only at CpG-rich promoters and leads to the aberrant silencing of tumor suppressors (38). These phenomena imply that DNA methylation status can be utilized in cancer diagnosis and surveillance. In this study, we therefore aimed to evaluate the potential of parallel serial profiling of somatic mutations and methylation levels using capture-based targeted DNA and methylated DNA sequencing, respectively, in order to monitor the response to osimertinib of advanced-stage lung adenocarcinoma patients.
Methods
Patients
Eight stage IV lung adenocarcinoma patients with EGFR T790M resistance mutations from Tongji Hospital Affiliated to Tongji Medical College of Huazhong University between August 2015 and October 2015 who are part of the AURA17 phase II osimertinib clinical trial (NCT02442349) were included in this study. All the patients received osimertinib 80 mg once daily until there was no clinical benefit according to investigator assessment. For the parallel analysis of the methylation and somatic mutation profile, plasma samples were longitudinally collected from the patients starting from baseline until the evaluation of PD. Detailed clinical examination and/or radiographic imaging were performed to evaluate their disease status. Tumor assessment for treatment response was investigator-assessed based on RECIST version 1.1 (3-5). This study was performed according to the Helsinki Declaration of 1964 and its current amendments. The study protocol has been approved by the Ethics Committee of Huazhong University of Science and Technology (approval number: 2015L01374/2015L01373). Written informed consent was provided by all the patients included in the study.
Sample collection and DNA isolation
Whole blood samples (8–10 mL) were collected in Cell-Free DNA BCT tubes (21892, Streck) and processed to obtain the plasma. Cell-free DNA (cfDNA) was extracted from the plasma using the QIAamp Circulating Nucleic Acid kit (55114, Qiagen, Valencia, CA, USA). Lung cancer tissue samples were obtained by biopsy and processed into formalin-fixed paraffin-embedded (FFPE) cell blocks. Genomic DNA was purified from FFPE tumor samples using a QIAamp DNA FFPE tissue kit (Qiagen, Hilden, Germany). The concentration and size profiles of isolated DNA were examined by Qubit 3.0 dsDNA HS assay (Thermo Scientific, Waltham, MA, USA) and HT DNA high sensitivity Labchip (Perkin Elmer, Norwalk, Connecticut, USA). All the procedures were performed according to the manufacturer’s protocols.
DNA library preparation for bisulfite sequencing
The bisulfite sequencing (BS-seq) library was prepared using the brELSATM method (Burning Rock Biotech, Guangzhou, China). Briefly, purified cfDNA were treated with sodium bisulfite (D5046, EZ-96 DNA Methylation-Lightning MagPrep, Zymo Research, Orange, CA, USA) to convert all the cytosine residues to uracil, but all the 5-methylcytosine residues were left unchanged. Subsequently, the converted single-strand DNA molecules were ligated to a splinted adapter, and copies of the template strands were generated in the presence of extension primers and an uracil-tolerating DNA polymerase. After the adaptor-ligation of the copy strands was completed a second time, 10 to 14 cycles of polymerase chain reactions (PCR) were performed to generate whole-genome BS-seq libraries. Custom-designed lung-cancer methylation profiling RNA baits were used for target enrichment covering 80,672 CpG sites and spanning 1.05 mega bases of human genome. Following a 12-to-16-hour hybridization step, biotinylated RNA probe-bound library fragments were selectively enriched and amplified with 14 PCR cycles. The target libraries were then quantified by real-time PCR (Kapa Biosciences Wilmington, MA, USA) and sequenced on NovaSeq 6000 (Illumina, San Diego, CA, USA) using 2×150 bp cycles.
Bisulfite sequencing data analysis
Custom adaptor sequences and low-quality bases were removed by trimmomatic (v.0.32). BWA-meth (v.0.2.2) was used to align paired-end reads to CtoT- and GtoA-transformed hg19 genome, respectively (39). After alignment, PCR duplicates were marked by Samblaster (v.0.1.20) (40), and reads with either low mapping quality (MAPQ <20) or improper pairing were removed by Sambamba (v.0.4.7) (41) from further downstream analyses. Paired reads sequences were merged using in-house scripts by clipping overlapping reads to avoid double-counting of methylation calls.
Identification of methylation blocks (MBs)
Pearson’s correlation analysis was performed between methylation frequencies of each pair of CpG markers penalized by genomic distance and methylation level difference. MBs were defined as the genomic region between the neighboring CpG sites in which the r2 value was calculated based on our modified correlation matrix. Methylation frequencies for entire MBs were calculated by summing up the numbers of Cs at all interrogated CpG positions within an MB and dividing by the total number of C+Ts at those positions.
Methylation ratio (MR) calculation
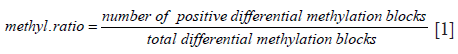
DNA methylation levels are reported as MR, calculated from the ratio between the number of positive differential MBs and the total differential MBs for each sample using the following formula:
MR PD prediction model
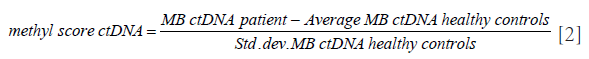
A MR prediction model for predicting PD was designed to calculate an MR score for each patient based on MBs detected in their tissue samples that showed a significant increase or decrease in methylation. The steps involved in calculating the MR scores are detailed as follows. (I) The MBs with no significant difference from the background methylation were removed. (II) T-test was performed to calculate the weighted methylation scores between MBs from tumor samples and MBs from adjacent normal tissue samples of the same patient. (III) The resulting weighted methylation scores from step 2 were arranged in descending order, selecting the MBs from the top 1,000 and bottom 1,000 that had a significant increase or a significant decrease in methylation, respectively. (IV) Another methylation score was computed for each of the MBs derived from the ctDNA of the patient normalized with the mean and standard deviation of MB from the ctDNA of healthy controls using the following formula:
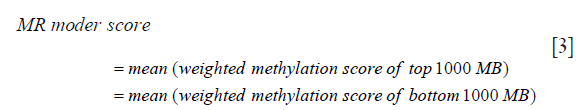
(V) The methylation score for the ctDNA from step 4 was multiplied with the corresponding absolute value of the weighted methylation score calculated from step 2 to derive the weighted methylation score for all the MBs selected from step 3. (VI) Finally, the MR model score was calculated as the difference between the mean of the weighted methylation score calculated from step 5 for the top 1,000 MBs and the mean of the weighted methylation score calculated from step 5 for the bottom 1,000 MBs using the following formula:
Capture-based targeted DNA sequencing
A minimum of 50 ng of DNA is required for next-generation sequencing (NGS) library construction. Fragments between 200 to 400 base pairs (bp) from the cfDNA were end-repaired, phosphorylated, and ligated with adaptors (Agencourt AMPure XP Kit, Beckman Coulter, CA, USA). Purified cfDNA with adaptors were then hybridized with capture probe baits, subjected to hybrid selection with magnetic beads, and PCR amplified. The quality and the size of the fragments were assessed using Qubit 3.0 fluorimeter with the dsDNA high-sensitivity assay kit (Life Technologies, Carlsbad, CA, USA). Indexed samples were sequenced on Nextseq500 (Illumina, Inc., USA) with paired-end reads and an average sequencing depth of 10,000X. A panel with 168 cancer-related genes, spanning 273 kilobases of the human genome, was used for targeted sequencing (Lung Plasma, Burning Rock Biotech, Guangzhou, China). Somatic mutations were analyzed using proprietary computation algorithms.
Statistical analysis
Differences in the groups were calculated and presented using either Fisher’s exact test or two-tailed Wilcoxon signed-rank test, as appropriate. P values with P<0.05 were considered statistically significant. All the data were analyzed using R statistics package (R version 3.4.0; R: The R-Project for Statistical Computing, Vienna, Austria).
Results
Patient characteristics and study design
A total of 8 metastatic lung adenocarcinoma patients harboring EGFR-sensitizing mutations and T790M were enrolled in the study. The cohort comprised 7 females and 1 male. All patients had received prior EGFR-TKI therapy, and 7 of the patients received prior chemotherapy regimen. Half of the cohort received palliative radiotherapy prior to osimertinib therapy. Details of patient characteristics are summarized in Table 1. Blood samples were collected at baseline prior to initiation of osimertinib therapy and longitudinally during the course of the treatment until the evaluation of PD with radiological imaging. Osimertinib therapy was administered to all the patients at 80 mg once daily. The follow-up interval was approximately every 30 to 40 days until confirmation of PD. The median follow-up time for all the patients was 12.6 months, ranging from 2.1 to 23.5 months. Progression-free survival (PFS) was defined from the date osimertinib was administered until the evaluation of PD by imaging modalities. Overall survival (OS) was defined from the date of osimertinib treatment until the day of death. Treatment responses were evaluated using radiological imaging with CT scan and assessed by investigators based on RECIST criteria as the gold standard. Paired somatic mutation and DNA methylation profiling were performed on the longitudinal blood samples.

Full table
Feasibility of detecting methylated DNA
To investigate the limit of detection of methylated DNA using our system, a serial dilution experiment was performed in vitro using commercially available CpG methylated genomic DNA (CH3-gDNA) derived from enzymatic CpG methylation of the genomic DNA from the Jurkat human male T lymphocyte cell line. The methylation level of CH3-gDNA was >97% according to manufacturer’s description. For the dilution experiments, CH3-gDNA were serially diluted with DNA derived from white blood cells of healthy donors to reach the target CH3-gDNA to a normal gDNA ratio of 0.1, 0.01, 0.001, 0.0005, and 0.0001. The serially diluted CH3-gDNA was then sequenced using the methylation panel. Although better detection is achieved with higher MRs, results demonstrated the detection of methylated DNA even at a ratio of 0.0001 (Figure 1).

Correlation between DNA methylation and maxAF
To evaluate the value of DNA methylation profiling in treatment monitoring of lung cancer patients, parallel methylation and mutation profiling of the 85 longitudinal plasma samples from the 8 patients were performed. MR and maximum allele fraction (maxAF) were used to reflect the DNA methylation levels and somatic mutation status, respectively. MaxAF is defined as the highest fraction of mutant allele detected in a particular sample, regardless of the gene or mutation site. The maxAF at various time points was normalized to its maximum value to derive the fraction of ctDNA present in the circulation of each patient. We analyzed the correlation between the MR and maxAF of each sample and the value of the MR in predicting the likelihood of detecting somatic mutations in samples.
The analysis revealed a positive correlation between MR and maxAF in 85 plasma samples, particularly when the samples were analyzed by patients (P=0.0002). Next, a receiver operating characteristic (ROC) curve was constructed to predict the probability of detecting samples without somatic variants using the MR. Based on the ROC curve, a MR of 0.9 is an ideal cut-off value for predicting samples without somatic variants, and it yielded a 46.9% sensitivity and a 96.8% specificity with an area under the curve (AUC) of 69.0%. Further analysis revealed that the plasma samples with detectable somatic mutations (maxAF >0%; n=49) had a significantly higher methylation level than the samples with no detectable somatic mutations (maxAF =0; n=33) (P=0.0003) and the samples of healthy controls (P=0.0018; n=196; Figure 2).

Longitudinal monitoring of DNA methylation and mutation status
Next, we extended our analysis to investigate the potential of longitudinal methylation profiling to monitor treatment response by examining the dynamic changes in methylation levels during the course of osimertinib therapy. A PD prediction model based on the MR derived from the patient’s plasma ctDNA and a tissue DNA sample was generated and reflected by the MR model score as described in subsection 2.7 of the methods section. In addition, the corresponding maxAF was also analyzed for comparison. Likewise, a PD prediction model based on somatic mutations frequently detected in lung cancer for early detection of PD was generated using Lasso. Except for a patient (P4) who had a TP53 mutation at AF of 4.95% as maxAF, the other 7 patients all had the EGFR-sensitizing mutation as maxAF ranging from 4.00% to 6.29%.
Generally, our analysis revealed four trends in treatment response. Group 1 included patients with a significant reduction in maxAF and methylation levels after initiation of osimertinib treatment, with the levels of both remaining low during the course of the treatment and gradually increasing, with the methylation level reaching up to a similar level as the baseline when radiological PD was confirmed (Figure 3A). Patients included in group 1 achieved stable disease (SD) at their first post-treatment radiological assessment. Six weeks from the first assessment, patients P2 and P3 both achieved partial response (PR). All 3 patients in this group developed EGFR C797S, with an average lead time of 2.8 months prior to radiological PD. The average PFS of this group was 13.7 months. The MR model score for P1 had a similar trend with both maxAF and methylation level. Two patients, P2 and P3 did not have adequate tissue samples for the calculation of the MR prediction model score and were the only patients without PD predicted by the MR model.

Group 2 included patients with a sharp increase in methylation levels after initiation of osimertinib therapy followed by a marked reduction observed at best response with the levels remaining relatively unchanged throughout the treatment duration (Figure 3B). Meanwhile, maxAF had a significant decrease after the initiation of osimertinib and dropped to undetectable levels at best response, remaining undetectable throughout the treatment. The 2 patients included in group 2 had PR as their best response. It is worthwhile to note that patient P6 had a sharp increase in both maxAF and methylation levels immediately after the initiation of osimertinib therapy followed by a sharp reduction to an almost undetectable level from the time the best response was achieved, remaining undetectable throughout the entire treatment duration until PD was evaluated. In contrast, the methylation level of P5 initially fluctuated and remained relatively unchanged from the time the best response was achieved, with a slight increase (from undetectable levels) in the methylation level observed 2 months prior to radiological PD but without returning to the baseline levels. The MR model score of the two patients had s similar trend with either maxAF or methylation levels, with P6 being more consistent or even overlapping with maxAF and P5 having a pattern similar to that of the methylation level.
Group 3 included patients with a methylation level that remained constant throughout the treatment duration even until PD, while the maxAF had gradual increases that reached the maximum level of twice as much as the baseline level at radiological PD (Figure 3C). Only 1 patient, P4, was included in group 3. The constant DNA methylation level, in addition to the increase in maxAF, might reflect no clinical benefit to the therapy. By extrapolating from the maxAF and methylation levels coupled with only 2 months of PFS, we speculate that this patient had de novo resistance to osimertinib due to the detection of MET amplification at baseline. Interestingly, the MR model score of P4 had a similar trend with the maxAF.
Group 4 included patients with methylation levels that fluctuated throughout the treatment duration (Figure 3D). P7 and P8 achieved PR and SD after 6 weeks of osimertinib treatment, respectively. We speculate that the low amounts of ctDNA might have contributed to the abnormal fluctuation of methylation levels observed in these patients. Despite the fluctuations, the pattern of the MR model score was more consistent with the pattern of the maxAF.
Taken together, these data suggest that even with the individual differences in the MR and maxAF among the patients, there are general patterns that may indicate treatment efficacy and impending PD, wherein treatment efficacy is reflected by significant reductions in methylation levels and maxAF, while significant increases reflect impending morphological PD.
Early molecular signs of PD predicted by various models prior to morphological PD assessed by imaging modalities
Next, we further compared the results obtained from somatic mutation and methylation profiling in predicting early PD. Figure 4 illustrates the detection of somatic mutations per sample and the predicted PD status of each of the patient during the course of the treatment until the evaluation of radiological PD. Among the 8 patients, molecular PD, defined as the emergence of new mutations or significant increase in allele fraction (AF) of existing driver mutations, was observed in 5 patients, including the 3 patients in group 1 and 1 patient each in groups 2 and 3, prior to radiological PD. There was an average lead time of 1.9 months even as early as 2.7 months in 2 patients. Early detection of the lung cancer model predicted PD based on the elevation of the AF of certain mutations in 7 patients, including 3 patients whose early detection model PD coincided with molecular PD, with a lead time of 3.0 months even as early as 8.0 months before the disease was measurable in a patient (P1). Unfortunately, only 6 patients were evaluable for the MR model due to insufficient tissue samples for the analysis. Among these 6 evaluable patients, the MR model predicted PD based on the significant elevation of MR in all 6 patients prior to radiological PD with an average lead time of 3.0 months and as early as 5.6 months in 2 patients (P6 and P7). Interestingly, P6 had changes in methylation levels with a lead time of 4.2 months prior to molecular PD. Moreover, P7, the only patient with no PD predicted by the early detection of the lung cancer model had methylation-based prediction of PD at 5.6 months prior to evaluation of PD by imaging methods. Table 2 summarizes the lead times of PD prediction using various methods.


Full table
Discussion
Overall, methylation levels, calculated by the MR model score, were more sensitive in reflecting early signs of PD as compared with mutation profiling, suggesting that DNA methylation could serve as a sensitive biomarker for monitoring treatment response to osimertinib in advanced lung adenocarcinoma patients. Our study thus provides evidence of the potential of parallel serial assessment of the somatic mutation and methylation profile of ctDNA for treatment monitoring of advanced lung cancer patients.
Currently, treatment responses are only evaluated by radiologic imaging guided by the RECIST criteria. However, radiologic imaging is limited in the evaluation of measurable disease in a specific region of the body. Instead of waiting for clinical symptoms to appear or disease relapse to be measurable by radiographic modalities before clinical decisions are made, treatment monitoring with serial molecular profiling of ctDNA could be performed to provide real-time information on the treatment response. The use of ctDNA from the blood could take into account the intra-and inter-tumor heterogeneity of both primary and metastatic lesions (10-12) and provide an overview of the treatment response at the molecular level. Numerous studies have demonstrated the potential of the serial assessment of ctDNA levels as a prognostic and predictive biomarker (13,18-20) which could also provide information on molecular signals of impending PD prior to radiologically evaluated PD (42,43).
Despite the substantial heterogeneity of somatic mutations associated with cancer development and progression, methylation patterns remain remarkably consistent (36,44). Early dynamic changes in the methylation status of ctDNA are correlated with response to therapy and disease burden, often preceding radiographic imaging-based assessments (44-46), suggesting that methylation patterns in ctDNA could serve as a viable biomarker to monitor disease burden and early therapeutic response (47-50).
Consistent with these reports, we have observed four general trends of treatment response based on the dynamic changes in methylation levels during the course of osimertinib treatment in our cohort study, despite the heterogeneity in their treatment history. The pattern of decreasing MR after the initiation of osimertinib therapy observed in patients P1, P2, and P3 were consistent with the therapeutic efficacy evaluated by imaging modalities. This early indication of efficacy can provide valuable information, particularly in advanced-stage patients. We also observed patterns in four patients (patients P5 to P8) whose disease responded to therapy despite fluctuations and slight decreases in the methylation levels. Furthermore, significant increases in the methylation level were observed before measurable PD in 5 patients: P1, P2, P3, P5, and P8. Our observations strongly support the previous findings supporting the notion that methylation levels could serve as a potential predictive biomarker of treatment efficacy and impending PD and that a measurement of its dynamic change could be a reliable method for treatment monitoring. Consistently, the somatic mutation and methylation status in most of our patients showed similar trends. Despite the individual differences in maxAF and methylation levels among the patients, patterns indicating treatment response or impending PD could be observed. Generally, a significant decrease in maxAF and methylation levels was correlated with efficacy, with undetectable maxAF or methylation levels primarily observed during the time when the best response was achieved; meanwhile, a significant increase in abundance or elevation of maxAF of existing somatic mutations or the emergence of new somatic mutations and the elevation of methylation levels were observed preceding the evaluation of PD using radiographic modalities in most of the patients in our cohort. Moreover, the PD prediction model based on the MR we have developed was also consistent with the trends of maxAF. Using the serial assessment of the somatic mutation profile, early signs of PD could be detected as the emergence of new mutations or a significant increase in AF of existing driver mutations, termed as molecular PD, in an average of 1.9 months and as early as 2.7 months prior to the morphological manifestation of PD. Meanwhile, serial assessment of DNA methylation levels could detect early signs of PD in an average of 3.0 months and as early as 5.6 months prior to radiological PD. PD was predicted in all patients evaluable for PD using the methylation-based prediction method, even for the only patient who did not benefit from osimertinib therapy at 1 month prior to radiological PD. Interestingly, among the 6 evaluable patients, 1 patient had PD detected 4.2 months prior to molecular PD and another patient had no molecular PD information but methylation-based prediction detected early signs of PD 5.6 months ahead of morphological manifestation of PD. Despite methylation level being more sensitive in reflecting treatment responses and impending PD, somatic mutation profiling also provides meaningful information for acquired resistance mechanisms and the selection of a subsequent treatment regimen. Hence, the parallel serial assessment of the dynamic changes in maxAF of somatic mutations and methylation levels during the course of osimertinib treatment could be powerful tools for treatment monitoring. The prompt detection of clinical benefit or impending PD during the course of the treatment could provide timely guidance in planning subsequent therapies to improve the prognosis of lung cancer patients.
It is interesting to note that the efficacy of osimertinib is still remarkable despite the treatment history of the patients. Excluding the patient (P4) who did not respond to osimertinib, the median PFS and OS of the 7 patients starting from the day of osimertinib treatment was 13.4 and 22.1 months, ranging from 6.5 to 23.8 months and 9.6 to 41.2 months, respectively (Table 1). These 7 patients had received at least 2 prior treatment regimens, with at least 1 prior chemotherapy regimen. Half of these patients also had prior radiotherapy. All 7 patients received osimertinib as third-line treatment and above.
Our study is severely limited by the small number of patients included in the analysis. To extend the implication of the noteworthy findings in our research, a study with a larger cohort is required to confirm the potential of serial assessment of ctDNA methylation profile in treatment monitoring for predicting clinical efficacy and impending PD. CtDNA methylation profiling should be offered as a companion to somatic mutation profiling and imaging modalities to provide a more comprehensive landscape of treatment response and to guide subsequent treatment options.
In conclusion, our study demonstrated the utility of the parallel serial assessment of ctDNA methylation and somatic mutation analysis in the treatment evaluation of lung cancer. We thus recommend their integration with imaging modalities for a more comprehensive treatment monitoring particularly in patients treated with targeted therapies. Our study contributes an incremental step in developing strategies that can allow early prediction of PD in osimertinib-treated patients to anticipate disease relapse and plan for subsequent therapies after confirmation of disease relapse.
Acknowledgments
The authors thank all the patients who participated in this study and their families. We also thank the investigators, study coordinators, operation staff, and the whole project team who worked on this study.
Funding: This work was supported by grants from the National Natural Science Foundation of China (grant number 81772471 to S.Xia), Double First-Class University Plan funding of 2016 from Tongji Medical College, Huazhong University of Science and Technology (grant number 5001540022 to S.Xia), and Qinghai Science and Technology Department Funding (grant number 2017-ZJ-709 to S. Xia).
Footnote
Conflicts of Interest: J Ye, A Lizaso, J Su, H Han-Zhang, and S Chuai are employees of Burning Rock Biotech. The other authors have no conflicts of interest to declare.
Ethical Statement: The authors are accountable for all aspects of the work in ensuring that questions related to the accuracy or integrity of any part of the work are appropriately investigated and resolved. The study protocol has been approved by the Ethics Committee of Huazhong University of Science and Technology (approval number: 2015L01374/2015L01373). Written informed consent was provided by all the patients included in the study.
References
- Mok TS, Wu YL, Thongprasert S, et al. Gefitinib or carboplatin-paclitaxel in pulmonary adenocarcinoma. N Engl J Med 2009;361:947-57. [Crossref] [PubMed]
- Jänne PA, Yang JC, Kim DW, et al. AZD9291 in EGFR inhibitor-resistant non-small-cell lung cancer. N Engl J Med 2015;372:1689-99. [Crossref] [PubMed]
- Eisenhauer EA, Therasse P, Bogaerts J, et al. New response evaluation criteria in solid tumours: revised RECIST guideline (version 1.1). Eur J Cancer 2009;45:228-47. [Crossref] [PubMed]
- Nishino M, Jagannathan JP, Ramaiya NH, Van den Abbeele AD. Revised RECIST guideline version 1.1: What oncologists want to know and what radiologists need to know. AJR Am J Roentgenol 2010;195:281-9. [Crossref] [PubMed]
- Schwartz LH, Litière S, de Vries E, et al. RECIST 1.1-Update and clarification: From the RECIST committee. Eur J Cancer 2016;62:132-7. [Crossref] [PubMed]
- Crowley E, Di Nicolantonio F, Loupakis F, et al. Liquid biopsy: monitoring cancer-genetics in the blood. Nat Rev Clin Oncol 2013;10:472-84. [Crossref] [PubMed]
- Mok T, Wu YL, Lee JS, et al. Detection and Dynamic Changes of EGFR Mutations from Circulating Tumor DNA as a Predictor of Survival Outcomes in NSCLC Patients Treated with First-line Intercalated Erlotinib and Chemotherapy. Clin Cancer Res 2015;21:3196-203. [Crossref] [PubMed]
- Alix-Panabières C, Pantel K. Clinical Applications of Circulating Tumor Cells and Circulating Tumor DNA as Liquid Biopsy. Cancer Discov 2016;6:479-91. [Crossref] [PubMed]
- Rathod A, Hopkins A, Rowland A, et al. Circulating cell free deoxyribonucleic acid for tracking early treatment response and disease progression in advanced cancers. Transl Cancer Res 2017;6:S1530-40. [Crossref]
- Volckmar AL, Sültmann H, Riediger A, et al. A field guide for cancer diagnostics using cell-free Dna: From principles to practice and clinical applications. Genes Chromosomes Cancer 2018;57:123-39. [Crossref] [PubMed]
- Mead R, Duku M, Bhandari P, Cree I. Circulating tumour markers can define patients with normal colons, benign polyps, and cancers. Br J Cancer 2011;105:239. [Crossref] [PubMed]
- Imamura T, Komatsu S, Ichikawa D, et al. Liquid biopsy in patients with pancreatic cancer: Circulating tumor cells and cell-free nucleic acids. World J Gastroenterol 2016;22:5627-41. [Crossref] [PubMed]
- Pécuchet N, Zonta E, Didelot A, et al. Base-Position Error Rate Analysis of Next-Generation Sequencing Applied to Circulating Tumor DNA in Non-Small Cell Lung Cancer: A Prospective Study. PLoS Med 2016;13:e1002199. [Crossref] [PubMed]
- Beaver JA, Jelovac D, Balukrishna S, et al. Detection of cancer DNA in plasma of patients with early-stage breast cancer. Clin Cancer Res 2014;20:2643-50. [Crossref] [PubMed]
- Klco JM, Miller CA, Griffith M, et al. Association Between Mutation Clearance After Induction Therapy and Outcomes in Acute Myeloid Leukemia. JAMA 2015;314:811-22. [Crossref] [PubMed]
- Tie J, Wang Y, Tomasetti C, et al. Circulating tumor DNA analysis detects minimal residual disease and predicts recurrence in patients with stage II colon cancer. Sci Transl Med 2016;8:346ra92. [Crossref] [PubMed]
- Reinert T, Scholer LV, Thomsen R, et al. Analysis of circulating tumour DNA to monitor disease burden following colorectal cancer surgery. Gut 2016;65:625-34. [Crossref] [PubMed]
- Birkenkamp-Demtröder K, Christensen E, Nordentoft I, et al. Monitoring Treatment Response and Metastatic Relapse in Advanced Bladder Cancer by Liquid Biopsy Analysis. Eur Urol 2018;73:535-40. [Crossref] [PubMed]
- Wan JC, Massie C, Garcia-Corbacho J, et al. Liquid biopsies come of age: towards implementation of circulating tumour DNA. Nat Rev Cancer 2017;17:223-38. [Crossref] [PubMed]
- Wang Y, Li L, Cohen JD, et al. Prognostic Potential of Circulating Tumor DNA Measurement in Postoperative Surveillance of Nonmetastatic Colorectal Cancer. JAMA Oncol 2019. [Epub ahead of print]. [Crossref] [PubMed]
- Warton K, Mahon KL, Samimi G. Methylated circulating tumor DNA in blood: power in cancer prognosis and response. Endocr Relat Cancer 2016;23:R157-71. [Crossref] [PubMed]
- Hoffmann AC, Vallbohmer D, Prenzel K, et al. Methylated DAPK and APC promoter DNA detection in peripheral blood is significantly associated with apparent residual tumor and outcome. J Cancer Res Clin Oncol 2009;135:1231-7. [Crossref] [PubMed]
- Wong IH, Zhang J, Lai PB, et al. Quantitative analysis of tumor-derived methylated p16INK4a sequences in plasma, serum, and blood cells of hepatocellular carcinoma patients. Clin Cancer Res 2003;9:1047-52. [PubMed]
- Sakakura C, Hamada T, Miyagawa K, et al. Quantitative analysis of tumor-derived methylated RUNX3 sequences in the serum of gastric cancer patients. Anticancer Res 2009;29:2619-25. [PubMed]
- Liggett TE, Melnikov AA, Marks JR, et al. Methylation patterns in cell-free plasma DNA reflect removal of the primary tumor and drug treatment of breast cancer patients. Int J Cancer 2011;128:492-9. [Crossref] [PubMed]
- Wang H, Zhang B, Chen D, et al. Real-time monitoring efficiency and toxicity of chemotherapy in patients with advanced lung cancer. Clin Epigenetics 2015;7:119. [Crossref] [PubMed]
- Schmidt B, Beyer J, Dietrich D, et al. Quantification of cell-free mSHOX2 Plasma DNA for therapy monitoring in advanced stage non-small cell (NSCLC) and small-cell lung cancer (SCLC) patients. PLoS One 2015;10:e0118195. [Crossref] [PubMed]
- Figueroa ME, Lugthart S, Li Y, et al. DNA methylation signatures identify biologically distinct subtypes in acute myeloid leukemia. Cancer Cell 2010;17:13-27. [Crossref] [PubMed]
- Irizarry RA, Ladd-Acosta C, Wen B, et al. The human colon cancer methylome shows similar hypo-and hypermethylation at conserved tissue-specific CpG island shores. Nat Genet 2009;41:178. [Crossref] [PubMed]
- Bird A. DNA methylation patterns and epigenetic memory. Genes Dev 2002;16:6-21. [Crossref] [PubMed]
- Jones PA. Functions of DNA methylation: islands, start sites, gene bodies and beyond. Nat Rev Genet 2012;13:484-92. [Crossref] [PubMed]
- Das PM, Singal R. DNA methylation and cancer. J Clin Oncol 2004;22:4632-42. [Crossref] [PubMed]
- Baylin SB. DNA methylation and gene silencing in cancer. Nat Clin Pract Oncol 2005;2 Suppl 1:S4-11. [Crossref] [PubMed]
- Baylin SB, Jones PA. Epigenetic Determinants of Cancer. Cold Spring Harb Perspect Biol 2016;8:a019505. [Crossref] [PubMed]
- Baylin SB, Jones PA. A decade of exploring the cancer epigenome—biological and translational implications. Nat Rev Cancer 2011;11:726. [Crossref] [PubMed]
- Sharma S, Kelly TK, Jones PA. Epigenetics in cancer. Carcinogenesis 2010;31:27-36. [Crossref] [PubMed]
- Eden A, Gaudet F, Waghmare A, Jaenisch R. Chromosomal instability and tumors promoted by DNA hypomethylation. Science 2003;300:455. [Crossref] [PubMed]
- Herman JG, editor. Hypermethylation of tumor suppressor genes in cancer. Seminars in cancer biology: Elsevier, 1999.
- Pedersen BS, Eyring K, De S, et al. Fast and accurate alignment of long bisulfite-seq reads. arXiv:14011129v2 [q-bioGN]. 2014.
- Faust GG, Hall IM. SAMBLASTER: fast duplicate marking and structural variant read extraction. Bioinformatics 2014;30:2503-5. [Crossref] [PubMed]
- Tarasov A, Vilella AJ, Cuppen E, et al. Sambamba: fast processing of NGS alignment formats. Bioinformatics 2015;31:2032-4. [Crossref] [PubMed]
- Almodovar K, Iams WT, Meador CB, et al. Longitudinal Cell-Free DNA Analysis in Patients with Small Cell Lung Cancer Reveals Dynamic Insights into Treatment Efficacy and Disease Relapse. J Thorac Oncol 2018;13:112-23. [Crossref] [PubMed]
- Newman AM, Bratman SV, To J, et al. An ultrasensitive method for quantitating circulating tumor DNA with broad patient coverage. Nat Med 2014;20:548-54. [Crossref] [PubMed]
- Lissa D, Robles AI. Methylation analyses in liquid biopsy. Transl Lung Cancer Res 2016;5:492-504. [Crossref] [PubMed]
- Grawenda AM, O'Neill E. Clinical utility of RASSF1A methylation in human malignancies. Br J Cancer 2015;113:372-81. [Crossref] [PubMed]
- Lu Y. Methylated DNA/RNA in body fluids as biomarkers for lung cancer. Biol Proced Online 2017;19:2. [Crossref] [PubMed]
- Xu RH, Wei W, Krawczyk M, et al. Circulating tumour DNA methylation markers for diagnosis and prognosis of hepatocellular carcinoma. Nat Mater 2017;16:1155-61. [Crossref] [PubMed]
- Visvanathan K, Fackler MS, Zhang Z, et al. Monitoring of serum DNA methylation as an early independent marker of response and survival in metastatic breast cancer: TBCRC 005 prospective biomarker study. J Clin Oncol 2017;35:751. [Crossref] [PubMed]
- Takahashi H, Kagara N, Tanei T, et al. Correlation of Methylated Circulating Tumor DNA With Response to Neoadjuvant Chemotherapy in Breast Cancer Patients. Clin Breast Cancer 2017;17:61-69.e3. [Crossref] [PubMed]
- Sandoval J, Méndez González J, Nadal E, et al. A prognostic DNA methylation signature for stage I non-small-cell lung cancer. J Clin Oncol 2013;31:4140-7. [Crossref] [PubMed]

