
Statistical control process to compare and rank treatment plans in radiation oncology: impact of heterogeneity correction on treatment planning in lung cancer
Introduction
The advance in technology provides successive generations of treatment planning system (TPS) and several techniques for radiotherapy. Therefore, the expected clinical results of radiotherapy are related to the calculated dose, which should be calculated using a dose calculation algorithm integrated in TPS. These algorithms show the results as dosimetric parameters displaying dose volume histograms or spatial dose distribution. Then, the validation of the treatment plan is based on the assessment of the TPS output. In this context, a challenge in radiation therapy for cancer treatment is to deliver the physical dose as close as possible to the prescription dose, depending on the accuracy of the dose calculation algorithms. The planed dose, given by the TPS, for each field could be compared with measured dose using Quality Assurance (QA) protocols according to the international recommendations (1-4). The gamma index (γ) tool allows to compare the spatial dose distribution displaying the dose difference with γ-maps (5-7). At this extend, using adaptive radiotherapy the initial planned dose can be compared with daily delivered dose. Nevertheless, γ and dosimetric data derived from dose volume histograms have some limits, and they are not able to predict if the initial plan, taken as reference, should be readjusted during treatment. The dose alteration, if ignored, could endanger the clinical outcome of the treatment. Therefore, the medical physicists have to optimize and readjust the reference plan. These changes are supposed to take into account the variation due to morphologic effects, resulting from alterations of target or organs at risks during treatment. One should provide the physicists and radiation oncologists a tool allowing them to assess the modifications and re-planning the treatment. This paper presents a statistical process control (SPC) implemented in a step-by-step procedure that should help the medical physicists comparing the dosimetric outcome of different plans during treatment. The procedures are presented using a real example to compare dose distribution from two radiotherapy plans. The goal is to provide interpretable results to make a medical decision regarding the change or any optimization that can be carried out to readjust the reference plan.
Methods
Treatment plans
This study is based on 40 fields, which were used to treat eight targets being lung cancers. The computed tomography images of each patient were loaded into Eclipse® TPS (Varian Medical Systems, Palo Alto, CA, USA). Clinicians delineated the anatomic borders of target structures (PTV) and organs at risks (OAR). Prescription dose ranged from 50 to 66 Gy, with a median of 57 Gy, in 2 Gy per fraction. Two different treatment plans were generated for each patient with 4 to 5 fields. The doses were firstly calculated using Pencil Beam modified Batho’s method and recalculated with Anisotropic Analytical Algorithm, making a change of dose distribution due to thoracic density heterogeneity (8-13).
Statistical process control method
Figure 1 shows the dosimetric and statistical process control to compare treatment plans in radiation oncology. To carry out the process, we take all pixels “samples” from the region of interest (ROI) and analyze the sample distribution around the tolerance limits following three steps. The first step, is a comparison of dose distributions pixel by pixel of plans 1 and 2, for the same patient, using the two dimensional (2D) γ-index. In second step, the pixels distribution around the specific limits should be analyzed by checking the normal test distribution. The distributions show different shapes and forms depending on average, standard deviation and variance. The Shapiro-Wilks test was used to assess the normality of data (14,15). In third step, data from γ analysis including the standard deviation and average can be used to determine Cp and Cpk, and then, the results are reported as the 95% confidence intervals. To measure the strength of the relationship between the γ passing rates and capability indices, Spearman’s rank non-parametric test is used to calculate P values.

Pixels by pixels analysis with 2D gamma
The dose distributions from plan 1 and plan 2, for the same patient, were compared using γ-index (7). Our goal was to determine the pixel ratio receiving the same irradiation. This γ tool combines two criteria including the dose difference in percentage and the distance to agreement in millimeters. An ellipse is used to determine the acceptable region, and γ≤1 represents fulfillment of the criteria. The DICOM images, including the dose distributions, for each plan were exported from TPS to RIT-113® (Dosimetry System Version 5.2, Radiological Imaging Technology, Inc., CO). The results can be displayed using γ-maps associated with cumulative dose pixel histograms. The pixels with γ≤1 are the pixels of the tested plan having the same dose distribution than the reference plan. Using the γ criteria (3%, 3 mm), we considered that the reference and tested plans were similar, if 95% of pixels had γ≤1.
Capability indices
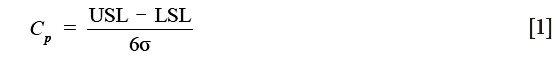
Two capability indices were calculated: process capability index (Cp) and process acceptability index (Cpk). The Cp, defined for data of normal distribution, measure the potential of the process to produce results within specification without taking into account the mean value of the process (16,17):
Cpk uses the mean and standard deviation of the process:
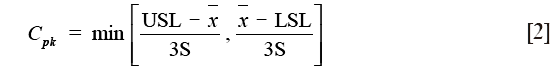
where USL and LSL are the upper and lower specification limits,  and S are estimators of the process mean and σ is the standard deviation.
For non-normal data, the nonparametric capability index, Cnpk, can be estimated as (17):
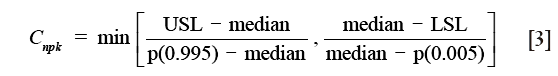
where Cnpk is an estimator of the nonparametric capability index, P (0.995) is the 99.5th percentile of the data, and P (0.005) is the 0.5th percentile of the data.
Figure 2 shows an example of the distribution shapes of data showing their relationship to the process target, USL and LSL with different capability ratios. It can be seen from Figure 2 that the values above one for Cp or Cpk show that the process is able to meet the control limits. The value of 1.0 means that the data spread is equal to the action limit width and process variability just meets specifications. The values below one show that the process is not able to produce itself within the specifications. However, Cp does not indicate the degree to which the process is centered on the target. Therefore, Cpk describes how close the process center is to the nearest specific limit, as shown in the lower panel in Figure 2.

Results
Comparisons of dose distribution
The tested plans yielded a lower dose compared to the reference ones, for target, the difference can reach 10%. Considering these results, the use of new plan instead of reference one to treat the patients would result in under dosage to PTV and over dosage to OAR. This difference may have a clinical impact compared to the reference plan and should therefore be investigated. The Shapiro-Wilks test showed a significant deviation from the normality. Figure 3 shows the distribution of the dose difference as a function of percentage of pixels, for reference and tested plans for 5 fields to treat one patient. In this case, the maximum difference was 6% and minimum difference was (−9%). The Cp and Cpk were 0.38 and 0.33, respectively.

Quantification of dose distribution sensitivity
Figure 4 shows the results of 2D γ including γ passing rates for all γ criteria. It can be seen that the tolerance limit of 95% of pixels having γ≤1 was respected with (6%, 6 mm). Figure 5 shows a sample of a 2D γ-maps in the axial views calculated from reference and tested plans for one patient. The red and blue coloring indicate that γ>1 and identifying over/under estimating dose, respectively, from tested plan compared to reference one.


Sensitivity of capability indices to measure the dose difference
Figure 6 shows the results of capability indices Cp and Cpk for all γ criteria. It can be seen in Figure 6 that the two plans yield much difference since the indices have values lower than the one. The indices showed the amplitude of discrepancy and change between the two plans. Both indices are increasing with increasing γ criteria.

Correlation between 2D gamma passing rates and capability indices
The data resulting from γ showed a strong correlation with P=0.8 and 0.9 for Cp and Cpk, respectively. Figure 7 shows the correlation for γ passing rates generated for all γ criteria with both capability indices.

Discussion
Among the numerous statistical methods available, we proposed and illustrated here a statistical process control to help the physicist to make a decision well adapted to compare dose distribution and to measure the amplitude of dose difference for radiation therapy plans, as for adaptive radiotherapy in the coming time. In case of comparison of dose distribution, the γ analysis is recommended to take into account the rank of the difference between each pair of pixels. However, this tool does not considers the size of the difference; it only shows if the γ criteria was applied. In this study, the Cp and Cpk indices were calculated according to dose difference measured pixel by pixels with γ. The Cp and Cpk have been used by others to assess linac constancy or to processes IMRT QA (18-23).
The example given in the present study concerning the dose distribution is a real example of comparison of two treatment plans in radiotherapy. The clinical results in radiotherapy rely on a rather narrow interval of planed dose and a small deviation should to be considered. Considering the allowed dose difference from tested plan compared to reference one is ±3%, a very dispersed dose difference was observed and the magnitude of the dose difference can reach up to ±10%. The γ passing rates give little information about the amplitude of dose differences. For example, using (3%, 3 mm) level, the γ passing rate shows only if the tolerance 95% of pixels with γ≤1 was respected or not between the two plans. Using the Cp and Cpk, we can get a valuable information about the amplitude of the dose difference. Interestingly enough, we observed a good correlation between capability indices and γ passing rates. Therefore, it can be adapted to compare any type of situation resulting at last in dosimetric differences as different irradiation methods or TPS. Here, they showed the change due to lung density correction by two different algorithms using the same beam configurations. They can also measure the degree of over/underestimation of dose for target and OAR. In this study, an increased dose within the OAR and decreased dose into the PTV was observed using tested plan which was normalized keeping the same prescription dose. The explanation was that the 95% isodose did not cover the same PTV fraction and that the isodose curves were more extended in lateral direction. This change can be rapidly observed with γ-index, but accepting 95% of pixels does not show the magnitude of the difference. This represents the limit of γ criteria to accept a treatment plan. Conversely, the use of capability indices allows the medical physicists to be aware about a dose change and the need to optimize the beam geometry to better cover the PTV by the reference isodose. Considering the present results, the tested plan would not be acceptable to treat the patient compared to the reference one.
We recommend making a distinction when calculating Cpk for normal/no-normal data and report the 95% confidence intervals, which seems to be important to understand the reliability of the process and its ability and capability. For no-normal data, the equation (3) can be used. We also recommend analyzing and measuring the dispersion of dose difference, with 2D or 3D γ, and to use capability indices, instead of using a single point, to compare the dose differences. The use of all data “pixels/voxels” provide a sufficient set of data to estimates Cp and Cpk and avoid the large variability of both indices.
Conclusions
We illustrate in this study the use of statistical process control to compare treatment plans in radiotherapy for the same patient. The relationship between capability indices, Cp and Cpk, with gamma passing rates was tested using Spearman’s test. Both indices measure the amplitude of dose difference, pixels by pixels better than gamma index. They can be used as complementary information to validate or optimize the treatment plan for adaptive radiotherapy during treatment or compare irradiation techniques.
Acknowledgements
This research is contributing to the ProtonShare project, and is partially supported by the French research funding agency, Agence Nationale de la Recherche, in the frame of the “Investments for the Future” under the reference: France HADRON, ANR-11-INBS-0007.
Footnote
Conflicts of Interest: The authors have no conflicts of interest to declare.
Ethical Statement: We declare that the article does not require a Statement of Ethics, since all the clinical material was anonymized CT-scans images used for dosimetric repeated assay’s at a remote time from the real treatment of the patients as mentioned in (2.1 Treatment plans section). Absolutely no information concerning the patients, them self, were used, so no consent were necessary. The study has been carried out in the University hospital of Grenoble, France.
References
- Ezzell GA, Burmeister JW, Dogan N, et al. IMRT commissioning: multiple institution planning and dosimetry comparisons, a report from AAPM Task Group 119. Med Phys 2009;36:5359-73. [Crossref] [PubMed]
- Alber M, Mijnheer B, Georg D, et al. Guidelines for the Verification of IMRT. Brussels, Belgium: ESTRO. 2008.
- Thwaites D. Accuracy required and achievable in radiotherapy dosimetry: have modern technology and techniques changed our views?. Journal of Physics: Conference Series 2013;444:012006. [Crossref]
- Chaikh A, Desgranges C, Balosso J. Statistical methods to evaluate the correlation between measured and calculated dose using a quality assurance method in IMRT. Int J Cancer Ther Oncol 2015;3:3411. [Crossref]
- Low DA, Harms WB, Mutic S, et al. A technique for the quantitative evaluation of dose distributions. Med Phys 1998;25:656-61. [Crossref] [PubMed]
- Spezi E, Lewis DG. Gamma histograms for radiotherapy plan evaluation. Radiother Oncol 2006;79:224-30. [Crossref] [PubMed]
- Chaikh A, Giraud JY, Balosso J. A 3D quantitative evaluation for assessing the changes of treatment planning system and irradiation techniques in radiotherapy. Int J Cancer Ther Oncol 2014;2:02033. [Crossref]
- Batho HF. Lung corrections in cobalt 60 beam therapy. J Can Assoc Radiol 1964;15:79-83. [PubMed]
- El-Khatib E, Battista JJ. Improved lung dose calculation using tissue-maximum ratios in the Batho correction. Med Phys 1984;11:279-86. [Crossref] [PubMed]
- Ojala J. The accuracy of the Acuros XB algorithm in external beam radiotherapy – a comprehensive review. Int J Cancer Ther Oncol 2014;2:020417. [Crossref]
- Report of Task Group No. 65 of the Radiation Therapy Committee of the American Association of Physicists in Medicine. Tissue inhomogeneity corrections for MV photon beams. Madison: Medical Physics Publishing. 2014. Available online: https://www.aapm.org/pubs/reports/rpt_85.pdf
- Rana S. Clinical dosimetric impact of Acuros XB and analytical anisotropic algorithm (AAA) on real lung cancer treatment plans Int J Cancer Ther Oncol 2014;2:02019. review. [Crossref]
- Rana S, Pokharel S. Dose-to-medium vs. dose-to-water: Dosimetric evaluation of dose reporting modes in Acuros XB for prostate, lung and breast cancer. Int J Cancer Ther Oncol 2014;2:020421. [Crossref]
- Chaikh A, Giraud JY, Perrin E, et al. The choice of statistical methods for comparisons of dosimetric data in radiotherapy. Radiat Oncol 2014;9:205. [Crossref] [PubMed]
- The R project for statistical computing. Available online: http://www.r-project.org
- Breen SL, Moseley DJ, Zhang B, et al. Statistical process control for IMRT dosimetric verification. Med Phys 2008;35:4417-25. [Crossref] [PubMed]
- NIST/SEMATECH e-Handbook of Statistical Methods. Available online: http://www.itl.nist.gov/div898/handbook/
- Cadman P, McNutt T, Bzdusek K. Validation of physics improvements for IMRT with a commercial treatment-planning system. J Appl Clin Med Phys 2005;6:74-86. [Crossref] [PubMed]
- Sanghangthum T, Suriyapee S, Srisatit S, et al. Retrospective analysis of linear accelerator output constancy checks using process control techniques. J Appl Clin Med Phys 2013;14:4032. [PubMed]
- Pawlicki T, Yoo S, Court LE, et al. Moving from IMRT QA measurements toward independent computer calculations using control charts. Radiother Oncol 2008;89:330-7. [Crossref] [PubMed]
- Gérard K, Grandhaye JP, Marchesi V, et al. A comprehensive analysis of the IMRT dose delivery process using statistical process control (SPC). Med Phys 2009;36:1275-85. [Crossref] [PubMed]
- Able CM, Hampton CJ, Baydush AH, et al. Initial investigation using statistical process control for quality control of accelerator beam steering. Radiat Oncol 2011;6:180-8. [Crossref] [PubMed]
- Nordström F, af Wetterstedt S, Johnsson S, et al. Control chart analysis of data from a multicenter monitor unit verification study. Radiother Oncol 2012;102:364-70. [Crossref] [PubMed]

