
Impact of dose calculation models on radiotherapy outcomes and quality adjusted life years for lung cancer treatment: do we need to measure radiotherapy outcomes to tune the radiobiological parameters of a normal tissue complication probability model?
Introduction
Radiotherapy plan evaluation could be performed by assessing physical parameters derived from dose volume histograms (DVH). However, the information drawn from DVH has some limitations. Among those, only dose points, one or several, in % or Gy, calculated for a given fraction of volume (Dv) can be used to constrain the treatment plans, etc. Constraint dose is also a single value, such as the volume ratio in % receiving a given dose (Vd). However, based on DVH, the radiobiological modelling allows to evaluate the clinical outcome of treatment plans such as the tumor control probability (TCP) and the normal tissue complication probability (NTCP). This needs several conditions. First, the most accurate DVH calculation, and second, an appropriate parameters’ setting before using the TCP/NTCP models. Recently, available treatment planning systems (TPS) have integrated some models to help optimize and rank radiotherapy plans (1). However, these biological models have also some limitations. They have been proposed several decades ago, and are thus based on radiobiology concepts adapted to the former generation of TPS. Their advantage is to predict TCP and NTCP probabilities and to give more quantitative information. In addition, instead of using multiple physical parameters as Dv, Vd and quality indices, a single integrative score was proposed using Uncomplicated tumor control probability (UTCP) metric, providing a more simple process to rank and compare treatment plans (2). Moreover, the UTCP score was recently proposed as a base for the estimation of the quality adjusted life years (QALY) providing the most integrated information by taking account of all structures concerned by the irradiation for a specific cancer site. While radio biological models and QALY bear a lot of promise, the basic choice of the dose calculation algorithm is critical, because the DVH, being the basis for any advanced model of prediction, should be calculated with the highest possible accuracy by the dose calculation algorithm integrated in the TPS. There is not enough evidence yet, about the ability of the dose calculation algorithms to yield accurate enough UTCP and QALY scores, to use them in routine clinical practice. In addition, there are no reports or statements showing the impact of dose calculation model on UTCP and QALY scores. In this study we have developed a method, easy to use by radiation oncologists or medical physicists, to estimate the predicted biological outcomes. It includes successive steps which can be applied with any TPS. Thus, the primary aim of the work is to highlight the differences in real delivered dose, TCP and NTCP scores, for treatment plans which exhibit differences in dose distributions i.e., pencil beam and point kernel algorithms for lung cancer. Secondly, to propose a way to use UTCP and QALY scores derived from TCP and NTCP data to obtain a comprehensive ranking of radiotherapy plans.
Methods
Dose calculation models
The dose calculations were performed using pencil beam model, as pencil beam convolution (PBC), and point kernel model, as anisotropic analytical algorithm (AAA). Both algorithms were integrated in Eclipse® TPS (Version 8.1; Varian Medical Systems). In both models, corrections for heterogeneities are performed. In this study, the PBC was used turning-on 1D density correction with Modified Batho’s (MB) method (3,4) and the kernel scaling by radiological path length along incident ray lines. For point kernel model (AAA), the principle is the kernel scaling by radiological path length along incident ray lines for 16 lateral directions. The AAA use pencil beams determined from Monte Carlo simulations. Three sub-sources are modeled, including primary photons, extra-focal photons and electron contamination. Heterogeneity correction in the AAA is partly similar to PBC algorithm but with some extent. It also takes account of the scattered radiation from the surroundings of the calculation point, i.e., in the lateral scaling of the medium it applies six independent exponential functions to account for the lateral transport of energy with varying densities (5,6). The Figure 1 shows the irradiation geometries for pencil beam and point kernel, the isodose curves are shown as full curves.

Clinical cases and treatment planning
Nine lung cancer cases treated with 3D conformal radiotherapy have been used in this study. Radiation oncologists delineated the target structures and organs at risk (OARs). For each patient, two treatments plans were generated using the same beams arrangements and prescription dose. The doses were calculated by PBCMB and AAA, respectively. The prescription dose in both plans was normalized to 100% at isocentre point inside the PTV and it ranged from 50.0 to 66.0 Gy.
Calibration of a NTCP model to assess the risk of toxicity
Assessment of TCP
The cumulative DVH (cDVH) were calculated from all plans and then converted into differential DVH (dDVH). The equivalent uniform dose (EUD) model proposed by Niemierko 1997, was used to calculate the TCP (7,8):
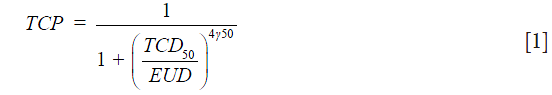
where TCD50 is the dose to control 50% of the tumors when the tumor is homogeneously irradiated. The factor (γ50) describes the slope of the dose-response curve. The parameters for TCD50 =51.24 Gy, and γ50 =0.83 were taken from Okunieff et al. for macroscopic tumor (9). EUD is calculated as:
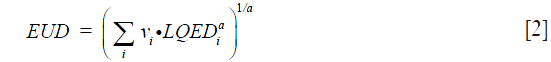
where (vi) is the fractional organ volume receiving a dose (Di) and (a) is a tissue specific parameter that describes the volume effect. In this study the value of (a) was equal to (−10) for target volume. To account for variations in dose per fraction in different sub volumes of a target or OARs, with changes in fractionation schedules, total physical dose corresponding to each DVH bin, (Di), was converted into iso-effective dose in 2 Gy fractions using linear quadratic (LQ) model [1].
Assessment of the risk of toxicity (NTCP)
The main objective of the current paper is to decipher the impact of the dose calculation algorithms on TCP and NTCP scores; and the second objective is to develop a method to use derived parameters from TCP and NTCP, namely UTCP, to establish a correlation with QALY. Ultimately, the goal would be to rank radiotherapy plans according to their global outcome represented by the QALY.
The Lyman-Kutcher-Burman (LKB) model was used for estimating NTCP on lung pneumonitis (10-12):
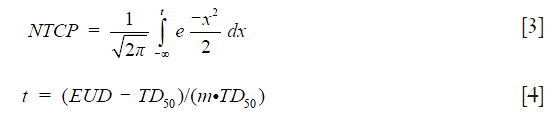
where TD50 is the tolerance dose for 50% complication rate of the normal organ. The parameter (m) represents the slope of the sigmoid dose response curve.
EUD is calculated as:
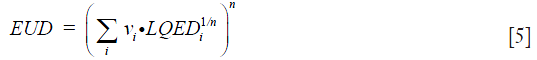
Considering radiation pneumonitis as late effect, the tissue-specific parameter α/β =4 Gy was used. In addition, for paired lungs (the two lungs considered as a unique organ) the radiobiological parameters using DVH from PBCMB were n=0.99, m=0.370, TD50 =30.78 Gy and for AAA, the parameters were: n=0.99, m=0.374, and TD50 =29.19 Gy (13,14).
Calculated quality adjusted treatment outcome score (Qc)
The UTCP is calculated as [2]:

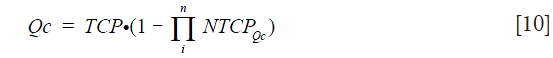
In order to quantify the real benefit of the treatment for the patient, the Qc could be considered as a derived weighted value of the UTCP to enter in the computation of a kind of calculated QALY as suggested by (15). Let’s give Qc as the following equation:

The Qc requires the development of advanced predictive models specific for patients treated with radiotherapy, e.g., EUD model. For this step, the most relevant DVH metrics should be calculated for the completed treatment (what has been really done) and with the most relevant algorithm, presently of the class of point kernel, like AAA as mentioned above. Then the Qc-value for each individual patient could be refined introducing complementary (clinical, biological, etc.) parameters by using a multivariate logistic regression formula for a derived value of NTCP we suggest to name NTCPQc, as defined below:
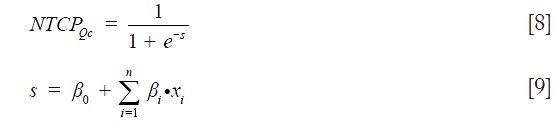
where (xi) refers to the parameters included in the multivariate model, such as V20 Gy, V30 Gy and mean dose for lung cancer. These parameters are strongly correlated with NTCP, predicting the toxicity for lung (16,17). The β0 is the initial value and the βi is a weighting factor, adjusted between zero and unity, for all relatively weighted parameters {xi}. βi can be estimated from correlation analysis using logistic regression as Spearman’s rank test for each DVH parameter. Uncertainties could be reduced by using bootstrapping simulation method (18).
Even more, to improve the model of prediction, the NTCP also could be estimated for each irradiated voxel (vi) and then a kind of cumulative NTCP could be obtained.
In this study only NTCP for lung from LKB model was estimated and introduced in Qc.
Measured QALY (Qm)
The validity and utility of the predictive radiobiological model should be tested for series of patients by reporting the specific toxicities, using toxicities grading systems as CTCAE (19), and more globally by measuring the quality of life, using for instance, EuroQol-5D and/or a specific module of EORTC QLQ (20,21). Such assessment should be systematically performed all along the follow-up of the patients for a period ranging from 6 months up to at least 5 years after the treatment (and even far more if very late effects as cardiovascular impairment should be detected). Then the Qc, estimated from in-silico computation as described above, could be correlated with the Qm and compiled to constrain the NTCP model, as a kind of continuous adjustment cycle. A better calibration should produce a better correlation coefficient from Qc and Qm and so on. Providing to have a sufficient number of patients to ensure that we can capture the variation within the patient population, the body of data could be extended even more by a bootstrap simulation method (22).
The Figure 2 shows the principle of the calibration method to estimate the calculated Qc score from DVH and its correlation with the measured QALY (Qm) from EQ-5D.

Statistical analysis
The delivered dose, EUD, TCP, NTCP and Qc were included in the analysis. A bootstrap simulation method with 1,000 random samplings was used to calculate the 95% confidence interval (95% CI). The Wilcoxon signed rank test was used to calculate the P value, P<0.05 was considered as a significance difference.
Results
Assessment of TCP
For target volume, the EUD in plan 2 using point kernel model, AAA, was significantly reduced predicting lower dose to the target compared with PBCMB from pencil kernel. The Figure 3 shows the 95% CI for prescribed dose and EUD from all plans. The Figure 4 shows an example of cDVH with PBCMB and AAA. It can be seen that PBCMB is overestimating the minimum dose, the percentage of the target volume that receives at least 95%, D95%, leading to more EUD and TCP compared with AAA. In this specific case, the EUDs were 66.6 and 65.2 Gy, respectively, with PBCMB and AAA. Thus, the TCPs were 70.4% and 68.9%, respectively. It can be seen also, with AAA, that the dose is most heterogeneous with higher S-index, S=2.8 Gy with PBCMB in plan 1 versus S =5.1 Gy with AAA in plan 2.


Approach of the calculated QALY (Qc)
For healthy lung (lung-PTV), AAA predicted more EUD leading to more NTCP compared with pencil beam model, with P=0.03. The Figure 5 shows the bootstrap simulation based on 1,000 replications for TCP, NTCP and Qc with cumulated average values from plan 1 and plan 2. It can be seen that the AAA yields lower TCP with higher NTCP compared to PBCMB. However, to conclude about which is the better plan, one should consider first which is the most accurate algorithm, here it is AAA. Thus, using the DVH from pencil beam model will significantly overestimate the predictive Qc score, justifying the use of the most accurate algorithms.

Correlation between Qc estimated from DVH with Qm from EQ-5D
The results in this study, from Figure 5, showed that the average NTCP was 5.1% and 4.1% using “a=1”, respectively with pencil beam model and point kernel model. This value should predict that 95–96% of patient would have a good quality of life. Since the Qm has not been established yet, one cannot confirm the calculated Qc, nor making any constrain on it. This shows, of course, the need to measured outcome to tune the parameters of the NTCP model. In the case of healthy state for the patient, the Qm should be close to the unity. Thus, the Qc from DVH would include a NTCP close to 0, showing a consistent calibration for the parameters of an NTCP model. In case of severe toxicity the Qm should be low, far from the unity. The Qc from DVH should thus predict a very considerable NTCP. If not, the parameters of the NTCP model are out of the appropriate values.
The Figure 6 shows a flowchart illustrating a proposal of a two-phase strategy to implement and calibrate an NTCP model in the clinic. In our study we used EUD concept, in this case the radiobiological setting “a=1/n” could be the critical parameter to adjusted.

Discussion
Dose differences between different dose planning algorithms, pencil beam and point kernel, is well known and have been published a number of times (23-25). In the present study we have used the recommend EUD model to compare dose calculation algorithms, as well as to evaluate radiotherapy treatment outcomes. This model was successfully used to estimate the EUDs from pencil beam and point kernel algorithms. Based on these well know differences between the calculated doses it cannot be a surprise that both TCP and NTCP differences will be found since they are monotonic function of delivered dose in the applied model.
Because point kernel model is a more accurate algorithm, taking account of the contribution of primary and secondary interactions for dose calculation, the results from AAA should be considered, here, as the most accurate data. The variations were due to the way the DVH metrics were calculated. Thus, differences in DVH binning have a key role of over/under estimating radiotherapy outcomes. In addition, UTCP, indicating the probability of controlling a tumor without causing severe normal tissue complications, and consequently Qc would be also over/under estimated. In this case, UTCP and Qc scores from point kernel with AAA should give an estimate closer to the reality of the patients outcome. However, the UTCP is here a very simplistic indicator, used to demonstrate the dependency of the biological modelization with the accuracy of the dose calculation, even beyond the choice of the radiobiological parameter setting of course, but also the type of organ, the type and level of severity of the complications, etc. In this study we only evaluated the NTCP for lung, as an example of application.
However, to obtain a realistic estimation of UTCP, consistent with the global assessment of the live quality, the toxicity for all the different tissues (e.g., spine, esophagus, heart…) should be combined into UTCP. Thus, taking account of all linked organs for a specific cancer site, we can predict the global risks as following:
where (i) represents the number of organs that would be taken into consideration.
However, one of the present limits of the available radiobiological models are firstly the parameters setting which are not adjusted to each dose calculation model. Secondly, the radiobiological models don’t take the clinical information related to the patient into account, including age, grade of toxicity, associated treatments, individual radio-sensibility, etc. A perfect model should predict the real NTCP integrating the radio-sensitivity and the above parameters.
Conclusions
We proposed a new approach well adapted to the fast improvement of radiation oncology. The introduction of UTCP metric and QALY score to rank radiotherapy plan is a new challenge to carry out the individual assessment of the treatment proposal of each patient. The calculated QALY concept based on DVH metrics should be associated with measured toxicity. However, a large body of cumulated medical data is needed to reduce the uncertainties in the assumptions used to predict NTCP and improve the calibration of the radiobiological models. The choice of the dose calculation model is also critical, since dose is the basis information of all these models.
Acknowledgements
We thank France HADRON, for their interest and assistance. This work has been partially funded by France HADRON (an academic non-profit organization) in the frame of the ProtonShare project.
Footnote
Conflicts of Interest: The authors have no conflicts of interest to declare.
Ethical Statement: We declare that the article does not require a Statement of Ethics, since all the clinical material was anonymized CT-scans images used for dosimetric repeated assay’s at a remote time from the real treatment of the patients as mentioned in section (2.2). Absolutely no information concerning the patients, them self, were used, so no consent were necessary. The study has been carried out in the University Hospital of Grenoble, France.
References
- Allen Li X, Alber M, Deasy JO, et al. The use and QA of biologically related models for treatment planning: short report of the TG-166 of the therapy physics committee of the AAPM. Med Phys 2012;39:1386-409. [Crossref] [PubMed]
- Agren A, Brahme A, Turesson I. Optimization of uncomplicated control for head and neck tumors. Int J Radiat Oncol Biol Phys 1990;19:1077-85. [Crossref] [PubMed]
- El-Khatib E, Battista JJ. Improved lung dose calculation using tissue-maximum ratios in the Batho correction. Med Phys 1984;11:279-86. [Crossref] [PubMed]
- Thomas SJ. A modified power-law formula for inhomogeneity corrections in beams of high-energy x rays. Med Phys 1991;18:719-23. [Crossref] [PubMed]
- Ulmer W, Harder D. A Triple Gaussian Pencil beam Model for Photon beam Treatment Planning. Z Med Phys 1995;5:25-30. [Crossref]
- Sievinen J, Ulmer W, Kaissl W. AAA Photon Dose Calculation Model in Eclipse™. Palo Alto (CA): Varian Medical Systems, 2005:1-18. (RAD #7170B).
- Niemierko A. Reporting and analyzing dose distributions: a concept of equivalent uniform dose. Med Phys 1997;24:103-10. [Crossref] [PubMed]
- Niemierko A. A generalized concept of equivalent uniform dose (EUD). Med Phys 2009;26:1101. Abstract WE-C2-9.
- Okunieff P, Morgan D, Niemierko A, et al. Radiation dose-response of human tumors. Int J Radiat Oncol Biol Phys 1995;32:1227-37. [Crossref] [PubMed]
- Lyman JT. Complication probability as assessed from dose-volume histograms. Radiat Res Suppl 1985;8:S13-9. [Crossref] [PubMed]
- Kutcher GJ, Burman C. Calculation of complication probability factors for non-uniform normal tissue irradiation: the effective volume method. Int J Radiat Oncol Biol Phys 1989;16:1623-30. [Crossref] [PubMed]
- Kutcher GJ, Burman C, Brewster L, et al. Histogram reduction method for calculating complication probabilities for three-dimensional treatment planning evaluations. Int J Radiat Oncol Biol Phys 1991;21:137-46. [Crossref] [PubMed]
- Hedin E, Bäck A. Influence of different dose calculation algorithms on the estimate of NTCP for lung complications. J Appl Clin Med Phys 2013;14:127-39. [PubMed]
- Chaikh A, Balosso J. Assessing the shift of radiobiological metrics in lung radiotherapy plans using 2D gamma index. Transl Lung Cancer Res 2016;5:265-71. [Crossref] [PubMed]
- Chaikh A, Balosso J. A decision protocol to propose proton versus photon radiotherapy: in silico comparison. Radiother Oncol 2016;119:S979-S980. [Crossref]
- Chaikh A, Balosso J. NTCP Variability in Radiotherapy of Lung Cancer When Changing the Radiobiologic Models and the Photon Dose Calculation Algorithms. J Cancer Clin Oncol 2016;2.
- Guldner L, Haddy N, Pein F, et al. Radiation dose and long term risk of cardiac pathology following radiotherapy and anthracyclin for a childhood cancer. Radiother Oncol 2006;81:47-56. [Crossref] [PubMed]
- Chaikh A, Giraud JY, Perrin E, et al. The choice of statistical methods for comparisons of dosimetric data in radiotherapy. Radiat Oncol 2014;9:205. [Crossref] [PubMed]
- Available online: https://ctep.cancer.gov/default.htm
- Available online: http://www.euroqol.org/
- Available online: http://groups.eortc.be/qol/
- Chaikh A, Balosso J. Correlation between pneumonitis risk in radiation oncology and lung density measured with X-ray computed tomography. Quant Imaging Med Surg 2016;6:413-7. [Crossref] [PubMed]
- Knöös T, Wieslander E, Cozzi L, et al. Comparison of dose calculation algorithms for treatment planning in external photon beam therapy for clinical situations. Phys Med Biol 2006;51:5785-807. [Crossref] [PubMed]
- Chaikh A, Balosso J. Statistical evaluation of dosimetric differences changes between the Modified Batho's density correction method and the Anisotropic Analytical Algorithm for clinical practice. Int J Cancer Ther Oncol 2016;4:4217. [Crossref]
- Chaikh A, Balosso J. Statistic and dosimetric criteria’s to assess the shift of the prescribed dose for lung radiotherapy plans when integrating point kernel models in medical physics: are we ready? Transl Lung Cancer Res 2016. [Epub ahead of print].

