
Advanced Proton Beam Dosimetry Part I: review and performance evaluation of dose calculation algorithms
Introduction
The importance of dose calculation in radiation therapy cannot be over-stated. The treatment plan generated by dose calculation program, commonly called a treatment planning system (TPS), is carefully evaluated by clinicians to maximize the probability of tumor control and minimize normal tissue complications (1). The quality of a patient’s treatment plan not only depends on the skill level of a planner but also on the inherent accuracy of the dose calculation algorithm. The accuracy of a dose calculation algorithm is a function of many variables: (I) quality of input data used in commissioning of the system, (II) implementation and related assumptions of physical processes of the underlying algorithm, (III) interpretation of patient image data, and (IV) heterogeneity of the anatomic site treated. For treatment of tumors in lung tissue, one of the biggest challenges is accurate dose calculation in a highly heterogeneous environment.
The majority of proton therapy clinics worldwide use one of the four commercially available FDA approved TPS: RayStation from RaySearch Laboratories (2,3), Eclipse from Varian Medical Systems (4), Pinnacle from Philips, and CMS Xio from Elekta (5). These planning systems support planning for multiple techniques for proton delivery including uniform scanning, double scattering, and spot scanning also known as pencil beam scanning (PBS) (6). The calculation accuracy of treatment plan dosimetry does not depend strongly on the delivery technique but instead is highly dependent on the dose calculation algorithm employed for planning. Currently, the available dose calculation algorithms can be divided into two classes: pencil beam (PB) and Monte-Carlo (MC) algorithms. Pencil beam algorithms are analytical in nature and the output dose distribution is constant for the same set of input parameters. On the other hand, MC dose calculation algorithms use random sampling of interaction cross-sections to simulate individual particles trajectories. The statistical nature of MC dose scoring result in variation of output dose distribution based on the number of particle histories in the simulations.
This article provides a brief review of PB and MC dose calculation algorithms employed in commercial treatment planning systems. Deficiencies of PB algorithms are first highlighted by presenting simplified examples of single sub-spot in a water phantom. Next, more typical cases of clinical beams in water phantom are presented and compared to measurements. Finally, a comparison is provided between PB and MC algorithms for a realistic clinical case in an anthropomorphic phantom. The findings of this article provide a foundation for the second article of the series, Advanced Proton Beam Dosimetry Part II: Monte Carlo vs. pencil beam-based planning for lung cancer.
Pencil beam algorithms for proton spot scanning
Currently, PB algorithms are the standard of care for treatment planning in proton therapy. The deficiencies of PB algorithms have been highlighted widely in the literature for many years by means of comparing PB algorithms to measurements or research based MC algorithm GEANT4 (7-11). Recently Paige et al. (12) used RaySearch’s commercially available RayStation MC to demonstrate the need for planning lung targets with MC. In spite of the reported limitations of PB algorithms, these algorithms are still universally used for treatment planning of all sites due to their speed and efficient clinical workflow.
The current variants of commercial implementation of PB algorithms are based largely on the works of Hong et al. (13) and Schaffner et al. (14). Only a very basic implementation of these algorithms is described here. Note that the following represents one possible implementation and that there are variations between different implementations. For details the reader is referred to the technical documentation per vendor. In PB algorithms, each spot in a proton PBS beam is decomposed into a subset of narrow beamlets commonly referred to as pencil beams. During patient dose calculation, pencil beams are transported into the patient surface along their central axis. The patient is modeled as a set of laterally infinite homogenous slabs where the material encountered along the central axis of each pencil beam is considered to be the material composition of the slab at each particular depth. As each pencil beam is transported through the patient volume, the dose to each voxel is determined based on analytical equations. Once all the pencil beams are transported, the doses are summed for each voxel resulting in a final calculated dose distribution. The range of the pencil beam is dependent only on the materials encountered along the central axis. This approach leads to PB algorithms being insensitive to lateral inhomogeneities and yield inaccurate dose distributions in the presence of complex geometries and heterogeneous environments. Another equally relevant shortcoming of the PB algorithm is its inability to account for the low dose envelope around the primary proton dose referred to as nuclear halo. The nuclear halo results from large angle scattered particles from multiple scattering, and more importantly, from nuclear reactions. There are many attempts to approximately include this so called halo dose in PB algorithms but none is free from problems. The halo issue appears most prominently for beams with a range shifter and a large airgap to the patient which are notoriously difficult to accurately model even in homogeneous water phantoms.
The general formalism for calculating dose using the PB algorithms is the convolution of proton fluence, ø, and the elemental pencil beam dose distribution called dose kernel K.
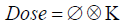
The dose kernel, K, describes the dose deposited in water by an infinitesimally narrow proton pencil beam and accounts for multiple coulombs scattering, energy loss, and energy loss straggling and nuclear absorption in the patient. The fluence term, ø, accounts for any beam spreading due to presence of beam modifiers before the patient plane. Practically, the dose is calculated on a discrete grid that converts the above convolution equation to a summation. For a voxel represented by location X, Y and Z, the dose is the sum of contributions from all voxels represented by Xi and Yi at each depth Z. The kernel is represented for depth Z' to account for total water-equivalent range at the central axis of the beam.

MC algorithms for proton spot scanning
MC dose calculation algorithms are based on a mathematical approach where the radiation transport equation is solved by use of random numbers and probability density distributions to represent the underlying physical interactions. If the modeling of the physics processes is accurate, the dose estimate provided by MC algorithms will converge to the measured dose as the number of particle histories is increased. MC algorithms track the energy deposited by individual particles inside the medium. Once the energy from all the simulated particles are deposited in respective voxels, the composite dose distribution is formed by summing all contributions. Dose calculation using MC algorithms should preferably start at a plane upstream of any patient specific beam modifier (apertures, compensator and range shifter) so that the impact of air gap and beam modifiers can be accounted for during the dose calculation in a patient. The transport of protons upstream of this plane is same for all patients and therefore does not need to be individually calculated. The beam characteristics such as particle type, energy distribution divergence and emittance are derived from the commissioning measurement and form the basis of a beam model to be used for patient calculations. A MC calculation to compute the dose from a spot in a PBS beam starts by randomly picking primary protons according to the beam model and transporting them through beam modifying devices, air gaps, and finally inside the patient. An individual particle will undergo physical interactions based on the interaction cross-sections in the medium of absorption. The interaction models for electromagnetic and nuclear interactions are based on theoretical models, parameterization, or experimental data (15). Energy deposition occurs when particles excite or dislodge orbital electrons or undergo nuclear interactions to produce additional particles such as protons, neutrons, deuterons, tritons, alphas, gammas, electrons and heavier fragments. These particles are tracked individually until their energy fall below a certain threshold when all the energy is assumed to be deposited locally. A sufficiently large number of source particle histories have to be run to achieve the required statistical precision in the dose distribution.
The use of MC algorithms to determine dose is stochastic in nature as it utilizes random sampling of probability distributions to determine the type of interactions and distance to next interaction. Following Poisson counting statistics, and without applying any variance reduction techniques, the uncertainty for dose in a voxel using MC algorithm is inversely proportional to the square root of the number of particles simulated. Therefore, to improve the statistical uncertainty by a factor of two, four times as many particles must be simulated. MC methods can potentially be very accurate and are in literature often referred to as a gold standard for dose calculation. However, this demands that all relevant aspects (physics, geometry, and technical implementation) are adequately accounted for. Historically, MC dose calculations for treatment plans have been performed using one of several existing research-based codes which are all too slow for routine dose calculations. Clinical use of MC for dose calculation has therefore traditionally been very limited due to the lack of a dedicated commercial implementation.
Recently, RaySearch Laboratories AB (Stockholm, Sweden) and Varian Medical Systems (Palo Alto, CA, USA) have offered commercial MC dose calculation algorithms for proton spot scanning. Due to their increased accuracy over PB algorithms, it is likely that MC dose calculations will become the new standard of care for clinical proton therapy treatment planning. In addition, as these implementations are dedicated for treatment planning purposes they are potentially also significantly faster than current general purpose research codes.
The speed gain arises from several contributing factors. For a patient dose calculation, transport takes place in a rectilinear voxel grid which means the geometry tracking can be made more efficient than what is possible in any general purpose code. Further, as the particle types, energy range and materials are bounded the modelling of nuclear interactions can be based on pre-computed cross section libraries instead of more complicated models employed in general purpose codes. Another technique that can be applied in a dedicated MC code, where the sought quantity is just average energy deposition per voxel, is to disconnect the transport and physics from the material and scoring grids. By this, multiple scattering and straggling need not be computed per voxel traversal which can save a considerable amount of computation time. A further degree of freedom regards which secondary particles the code tracks. As an example, the approach chosen in the case of the RayStation implementation is summarized below. Production of secondary electrons from energy loss ionization events (“Delta electrons”) is disregarded. This is justified by the fact that released electrons have on average a very short range and is irrelevant for the calculation of physical dose in voxels of size 1 mm or larger. For example, for a 200 MeV proton the highest delta electron energy is around 500 keV corresponding to a range of 2 mm water. Fortunately, the cross section is strongly peaked towards lower energies and the net effect becomes negligible [see discussion in ICRU report 55 (16) and references therein]. Elastic scattering of protons on hydrogen is explicitly modelled and the outgoing protons are tracked individually. For emission of secondary ions following non-elastic nuclear reactions only protons, deuterons and alpha are considered (amounting to a few percent of the total local dose). Other ions and the residual nucleus are considered to deposit all released energy locally. Neutrons and gammas are considered to leak out without depositing energy. The fraction of the non-transported energy (local deposition and leaking out) must be modelled and accounted for to respect a correct energy balance. Regarding the neutrals, it should be pointed out, that input to the beam commissioning process is usually a measured integrated depth dose with contributions from all occurring reaction channels including energy deposition by neutrals. Hence, their in-field contribution becomes implicitly included the dose calculation. It is only the out-of-field dose which is neglected. As in the case for PB algorithms, for further details the reader must be referred to the respective vendor’s technical documentation.
Comparison of MC and PB dose calculation algorithms
PB algorithms have many drawbacks that may result in inaccurate proton beam dose calculations. One of the limitations is due to their inability to handle beam incidence at an oblique angle. As described earlier, PB algorithms account for inhomogeneities by dividing a wide proton beam in to smaller beamlets called pencil beams. For proton spot scanning implementation in RaySearch’s RayStation and CMS’s Xio treatment planning systems, these beamlets are referred to as sub-spots. The number of sub-spots in a single pencil beam is called sub-spot resolution. Higher sub-spot resolution is advantageous as it increases the dose calculation algorithm’s ability to handle inhomogeneities. Generally, there is a trade-off to be made in increasing sub-spot resolution as it also increases the dose calculation time. It is due to this that commercial treatment planning system find a balance between sub-spot resolution and dose calculation times. In the RayStation TPS for proton spot scanning, a sub-spot resolution of 1 or 19 can be used. In CMS Xio TPS, the sub-spot resolution is a user selectable parameter and allows a single pencil beam to be split into a range of 1 to 121 sub-spots.
Even though PB algorithms decompose spots into sub-spots to improve the inhomogeneity handling, discrepancy between actual and predicted dose can still occur. Figure 1 shows a simulation of a single sub-spot incident on a water phantom at an oblique angle of 45 degrees. All the protons within the sub-spot have same energy and thus should roughly travel to same depth inside the phantom. In this demonstration, the proton range was set to 7.5 cm. As can be seen, the PB algorithm was able to correctly predict the range on central axis of the sub-spot to be 7.5 cm. However, the range of protons at the periphery of sub-spot is either greater or smaller than 7.5 cm. The deviation of the range within a single sub-spot becomes larger as sub-spot size increases. As a sub-spot is just an element from a larger parent spot, its size increases as the parent spot size increases. Therefore, beams with larger spot sizes could see a bigger deviation between the TPS modeled and actual doses. The example shown in Figure 1A was re-calculated with a MC algorithm and is shown in Figure 1B. It can be seen that MC accounts for obliqueness of the surface and accurately depicts dose for all protons within the sub-spot.

As a treatment is never performed with a single spot, let alone a single sub-spot, the impact of finite sub-spot size on quality of a plan should be studied with a clinically relevant beam. We evaluated the performance of a commercial pencil beam analytical algorithm using a phantom set up shown in Figure 2A. A 2-cm thick target was created in a water phantom at 5.5 cm depth and irradiated with a single oblique beam at 45 degree incidence. The original plan was optimized using the PB algorithm (Figure 2B) to deliver a uniform dose of 5 Gy to the target. The PB plan was copied and re-calculated with the MC algorithm (Figure 2C). The dose measurements were made on the central axis of the beam using a commercial 2-D detector array (Matrixx PT detector, IBA Dosimetry, Schwarzenbruck, Germany). The discrepancy between the measured and TPS calculated depth dose is shown in Figure 2D. From the depth dose analysis, it can be seen that the PB algorithm was not able to correctly predict the distal fall-off of the beam when oblique incidence is used. The PB algorithm showed broadening of the distal fall-off while the MC algorithm matched the measurements well. Figure 2D also shows local point-by-point dose differences between measurements and PB/MC algorithms. For MC algorithm, all the measurements were within ±5% from predicted at dose points >10% of maximum dose. For PB algorithm, dose errors of up to 30% were noted for some points.

To further demonstrate how PB algorithms handle the heterogeneous features within patient anatomy, an illustration is shown with two sub-spots in water phantom that has a bone insert (Figure 3). Both the sub-spots have same proton energy and therefore should travel the same distance in a water phantom. Both sub-spots were incident at the water-bone interface such that only a partial sub-spot was going through bone insert. Sub-spot A was positioned such that its central axis lies in the water while sub-spot B was slightly displaced laterally to have the central axis go through the bone material. Pencil beam algorithms assume the material on the central axis to be laterally infinite, i.e., the range of the sub-spot is determined by the material on the central axis. In other words, it fails to account for the portion of the sub-spot that may be traversing through a material of different density. This is illustrated in Figure 3A, where all protons in sub-spot A are stopping at the same distance thus ignoring the bone slab. Similarly, protons in sub-spot B are behaving as if all the protons are going through the bone slab. Figure 3B is the same configuration calculated by the MC algorithm. Here it can be seen that the MC algorithm is able to accurately account for range of all protons in a sub-spot that are partially traversing through bone insert.

In a complex patient plan, one may not be able to see the impact of individual sub-spots. A patient plan can have thousands of spots and thus many thousands of sub-spots in which differences due to individual elements may not be clearly appreciable. To illustrate the magnitude of dose differences in a clinical beam, we created a phantom by placing commercially available bone and lung equivalent slabs in a solid water phantom (Figure 4). The slabs were placed next to each other such that the interface coincided roughly with the central axis of the beam. This deliberate placement of slabs was done to test the dose calculation algorithm’s ability to correctly predict the transport of proton at the interface of bone and lung material. A 2-cm thick target was assumed underneath the bone-lung slabs. Dose was calculated using both PB and MC algorithms. Measurement of the lateral dose profile was made using Gafchromic EBT3 film (Ashland Inc., NJ, USA) placed immediately behind the bone-lung slabs and compared to both algorithms . The irradiated films were scanned 24 h post exposure on a flatbed scanner (Epson Expression 11000XL, Epson America Inc., California, USA) using 72 pixels per inch of resolution and landscape orientation. The digitized films were analyzed using the commercially available DoseLab software (Mobius Medical Systems, TX, USA). A control film that was similarly handled but not exposed was also scanned to obtain net optical density using the red channel. Figure 4D shows that pencil beam algorithm fails to account for the inhomogeneity caused by the bone-lung interface. The pencil beam algorithm overestimates dose at the interface on the bone side and underestimates the dose on lung side. The lateral dose profile predicted by the MC algorithm matches the measurement well on both lung and bone side.

For treatment of targets in lung, the geometry is much more complex compared to aforementioned simplified bone-lung interface. Parts of the proton beam will go through many different interfaces formed by air, lung, adipose, muscle, other soft tissue, and bone. The combined effect of the inhomogeneities could result in substantial dose differences between PB and MC algorithms. In order to evaluate the dose differences in a geometry closer to a patient anatomy, we created a test plan in an anthropomorphic phantom (3). A mediastinum section of the phantom (Figure 5) was scanned on GE CT scanner and a pseudo target of diameter 10 cm and length 9 cm was assumed inside the phantom. The slices of the phantom were intentionally selected to have various tissue interfaces that run parallel to beam direction. The treatment plan was prepared using the PB algorithm to deliver 40 Gy uniform dose to the target. The plan was then copied and calculated with MC algorithm. Measurements were made using the Gafchromic EBT3 films that were sandwiched between the slices of the phantom. The qualitative results of film measurements and comparison with PB and MC algorithm are shown in Figure 5. As can be seen, MC algorithm correctly predicted the dose at all depths and matched with the film measurements. For the PB algorithm, the predicted doses matched well with measured in the entrance planes. There was an increasing amount of mismatch between measured and PB algorithm in the distal region of the beam with substantial dose differences for last two planes at depths 15 and 17.5 cm.

Conclusions
These simplified examples show the deficiencies of PB algorithms and highlight the need for implementing MC for complex anatomic geometries. For sites like lung, there are generally complex tissues interfaces due to lung, normal tissue, and bone that are not be completely accounted by PB algorithm. In one recently published study (12), previously failed IROC lung phantom tests were re-evaluated using the MC algorithm. The dose distribution obtained with the MC algorithm matched the phantom irradiations for most of the cases that previously failed using the pencil beam algorithm. Even the institutions that initially passed the lung phantom irradiation using PB algorithm, showed improvement when analysis were repeated with MC algorithm. This article summarized a variety of phantom cases to demonstrate the improved accuracy of commercial MC algorithm over a conventional analytical PB algorithm. However, it is important to translate those improvements to clinical patient cases and show the differences in dose distributions that are expected from using an improved dose calculation algorithm. In Part II of this series, we will describe the impact of MC-based dosimetry and optimization on lung cancer treatment planning. This clinical investigation includes the retrospective analysis of lung cancer patients treated in our clinic to compare PB-optimized treatment plans and MC dose calculations of those same plans. The plans were then re-optimized using the MC algorithm to evaluate whether deficits in target dosimetry or violations in normal tissue constraints could be restored.
There are other considerations for use of MC for routine treatment planning. Although the commercially offered MC algorithms are very efficient compared to generic research based codes such as GEANT4, their dose calculation and plan optimization speeds are still slower than PB algorithms. When used in conjunction with robust optimization, the performance of MC algorithms could experience further slowdown. However, the utilization of MC algorithms should keep on increasing due to continuing improvements in computer processing and further optimizations in algorithm implementation.
Acknowledgements
None.
Footnote
Conflicts of Interest: The authors have no conflicts of interest to declare.
References
- Chen WZ, Xiao Y, Li J. Impact of dose calculation algorithm on radiation therapy. World J Radiol 2014;6:874-80. [Crossref] [PubMed]
- Saini J, Cao N, Bowen SR, et al. Clinical Commissioning of a Pencil Beam Scanning Treatment Planning System for Proton Therapy. Int J Particle Ther 2016;3:51-60. [Crossref]
- Saini J, Maes D, Egan A, et al. Dosimetric evaluation of a commercial proton spot scanning Monte-Carlo dose algorithm: comparisons against measurements and simulations. Phys Med Biol 2017;62:7659-81. [Crossref] [PubMed]
- Lin L, Huang S, Kang M, et al. A benchmarking method to evaluate the accuracy of a commercial proton monte carlo pencil beam scanning treatment planning system. J Appl Clin Med Phys 2017;18:44-9. [Crossref] [PubMed]
- Doolan PJ, Alshaikhi J, Rosenberg I, et al. A comparison of the dose distributions from three proton treatment planning systems in the planning of meningioma patients with single-field uniform dose pencil beam scanning. J Appl Clin Med Phys 2015;16:4996. [Crossref] [PubMed]
- Liu H, Chang JY. Proton therapy in clinical practice. Chin J Cancer 2011;30:315-26. [Crossref] [PubMed]
- Bueno M, Paganetti H, Duch MA, et al. An algorithm to assess the need for clinical Monte Carlo dose calculation for small proton therapy fields based on quantification of tissue heterogeneity. Med Phys 2013;40:081704. [Crossref] [PubMed]
- Grassberger C, Daartz J, Dowdell S, et al. Quantification of proton dose calculation accuracy in the lung. Int J Radiat Oncol Biol Phys 2014;89:424-30. [Crossref] [PubMed]
- Schuemann J, Giantsoudi D, Grassberger C, et al. Assessing the Clinical Impact of Approximations in Analytical Dose Calculations for Proton Therapy. Int J Radiat Oncol Biol Phys 2015;92:1157-64. [Crossref] [PubMed]
- Schuemann J, Shin J, Perl J, et al. SU-E-T-500: Pencil-Beam versus Monte Carlo Based Dose Calculation for Proton Therapy Patients with Complex Geometries. Clinical Use of the TOPAS Monte Carlo System. Med Phys 2012;39:3820. [Crossref] [PubMed]
- Tourovsky A, Lomax AJ, Schneider U, et al. Monte Carlo dose calculations for spot scanned proton therapy. Phys Med Biol 2005;50:971-81. [Crossref] [PubMed]
- Taylor PA, Kry SF, Followill DS. Pencil Beam Algorithms Are Unsuitable for Proton Dose Calculations in Lung. Int J Radiat Oncol Biol Phys 2017;99:750-6. [Crossref] [PubMed]
- Hong L, Goitein M, Bucciolini M, et al. A pencil beam algorithm for proton dose calculations. Phys Med Biol 1996;41:1305-30. [Crossref] [PubMed]
- Schaffner B, Pedroni E, Lomax A. Dose calculation models for proton treatment planning using a dynamic beam delivery system: an attempt to include density heterogeneity effects in the analytical dose calculation. Phys Med Biol 1999;44:27-41. [Crossref] [PubMed]
- Paganetti H. Monte Carlo simulations will change the way we treat patients with proton beams today. Br J Radiol 2014;87:20140293. [Crossref] [PubMed]
- Secondary Electron Spectra from Charged Particle Interactions. International Commission on Radiation Units and Measurements, ICRU Report 55 1996.

